India, built in the open.
A nation, unfolding in data.
India's transformation under the BJP-led NDA government since 2014 — infrastructure, economy, health, defence, digital and more — sourced, mapped, and there to see.
Under Prime Minister Narendra Modi, government spending on building the country rose roughly six-fold in a decade — from about ₹2 lakh crore a year in 2014 to over ₹11 lakh crore today. This is what that bought.
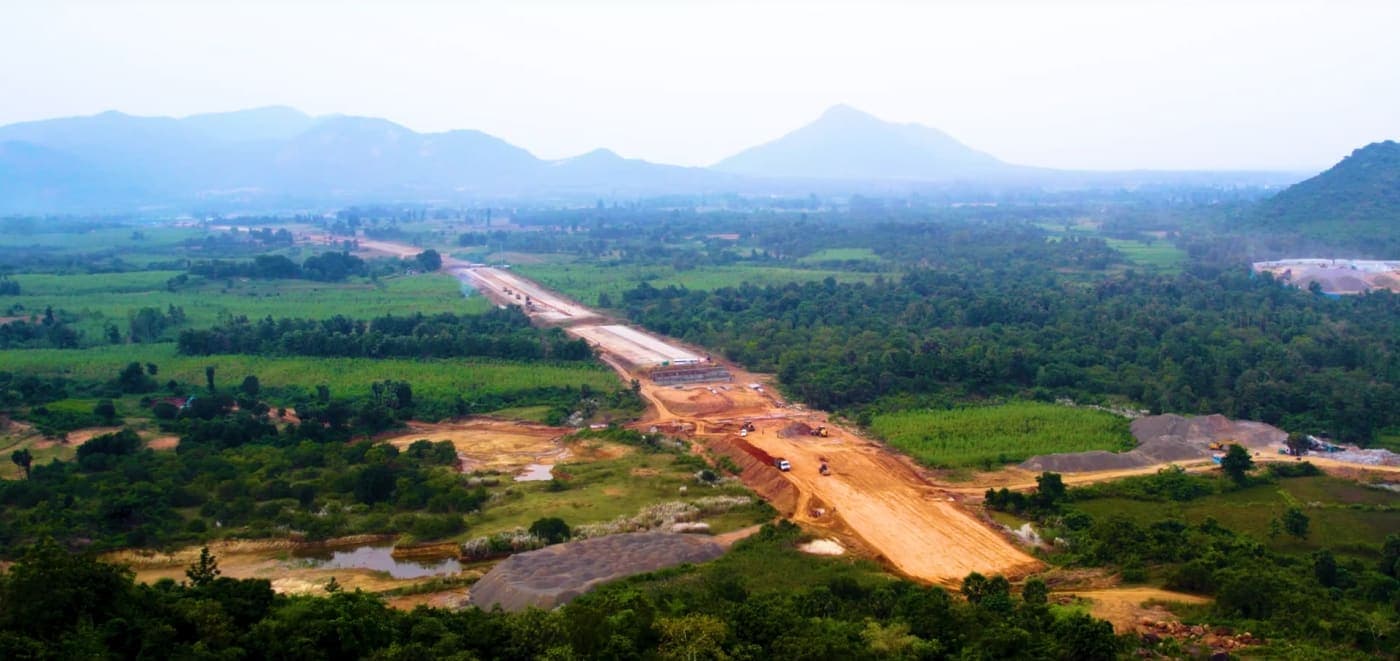
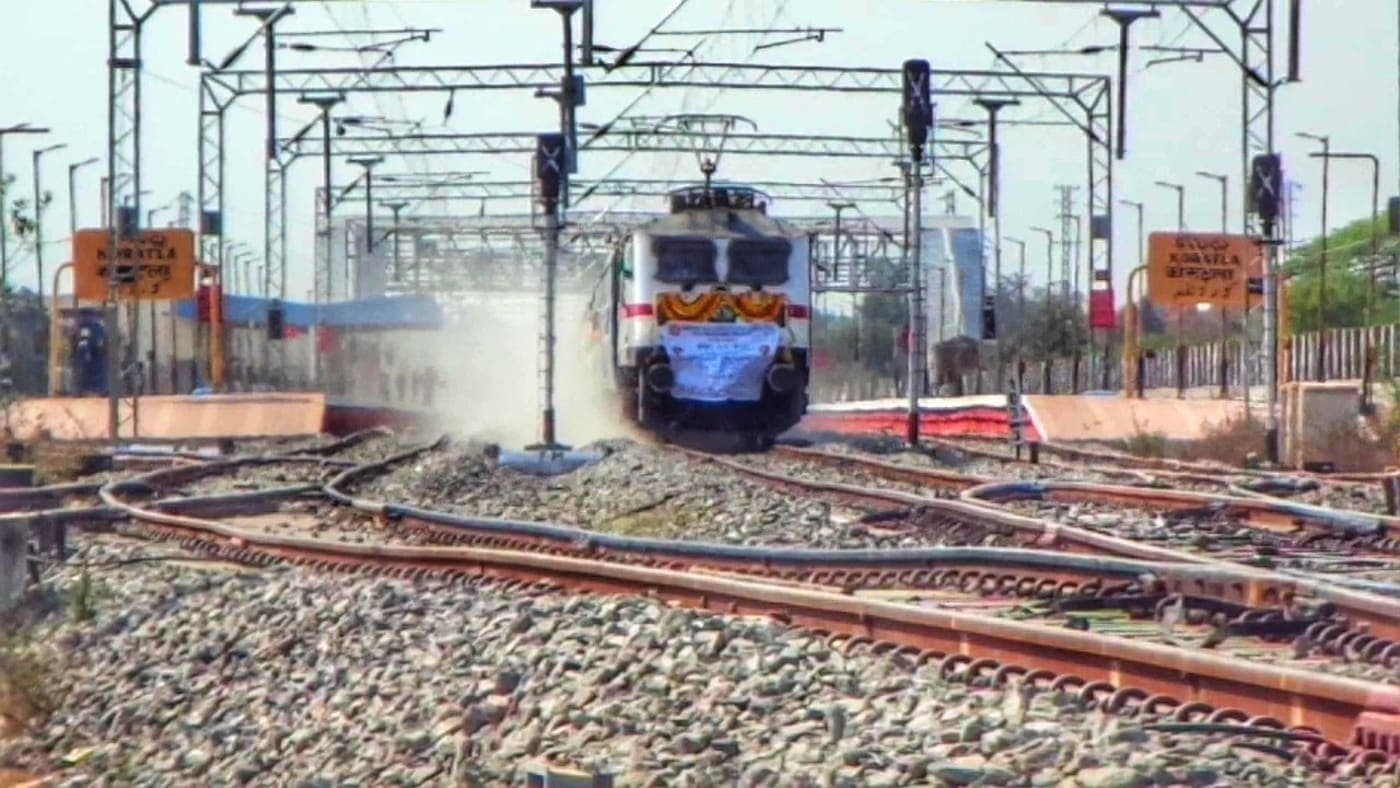
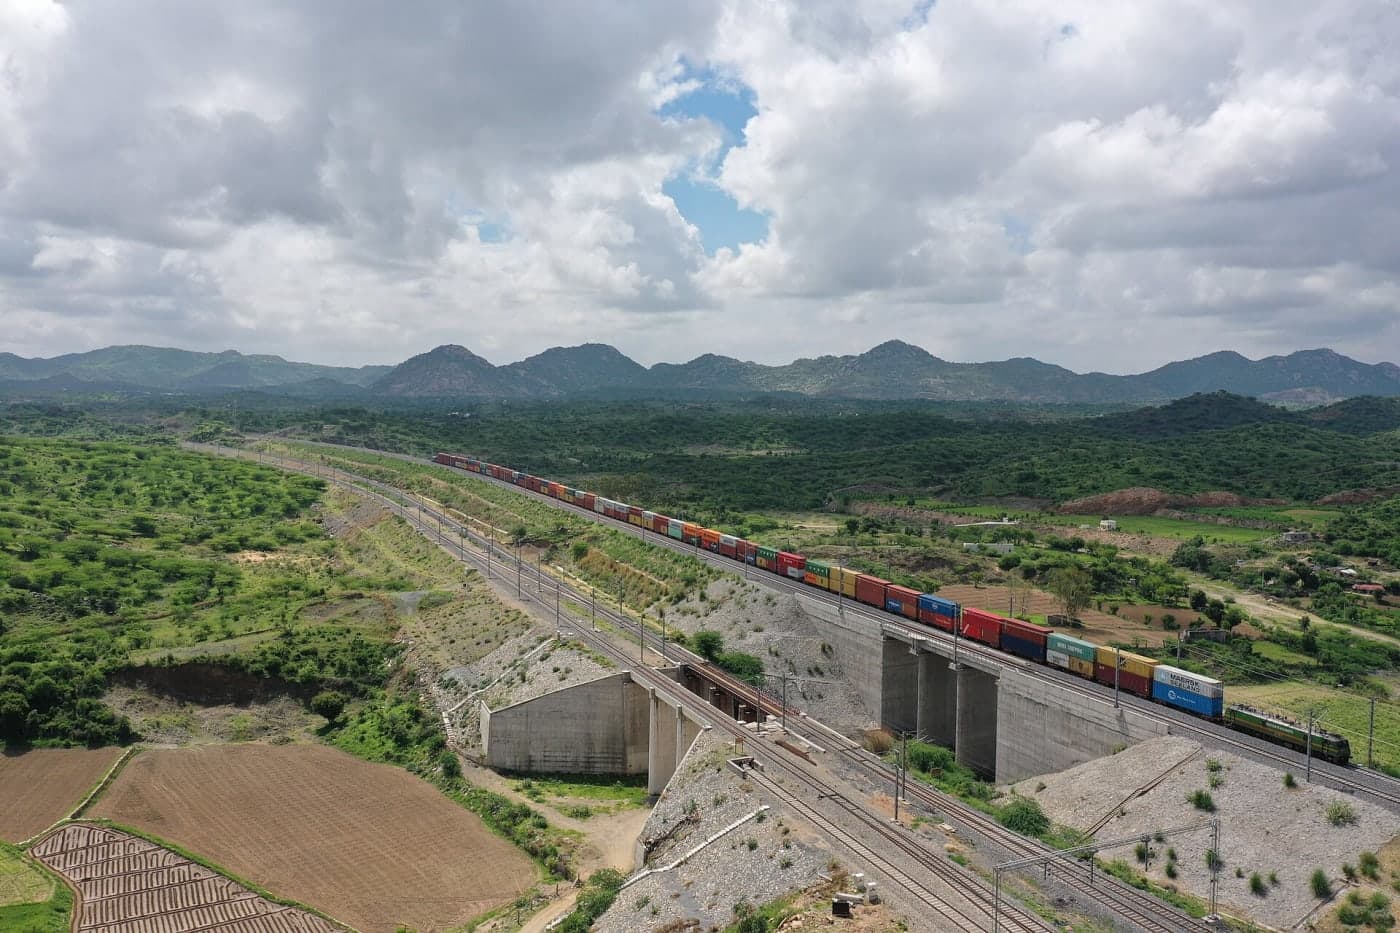
National highways grew by more than half. Rail electrification now covers 99.6% of the broad-gauge network. Airports grew from 74 to 165. UPI, a homegrown payments network, went from almost nothing to over 240 billion transactions in 2025-26. Every village was electrified, and crores of families received a toilet, a cooking-gas connection, a bank account and health cover — the basics, delivered to everyone rather than most.
India Unfolding maps, counts, and animates that transformation — across every sector, year by year — so you can watch a nation build itself through a decade of decisive governance.
Figures compiled from public sources — Union Budget, RBI, World Bank, MoRTH, Ministry of Railways, NPCI and others.
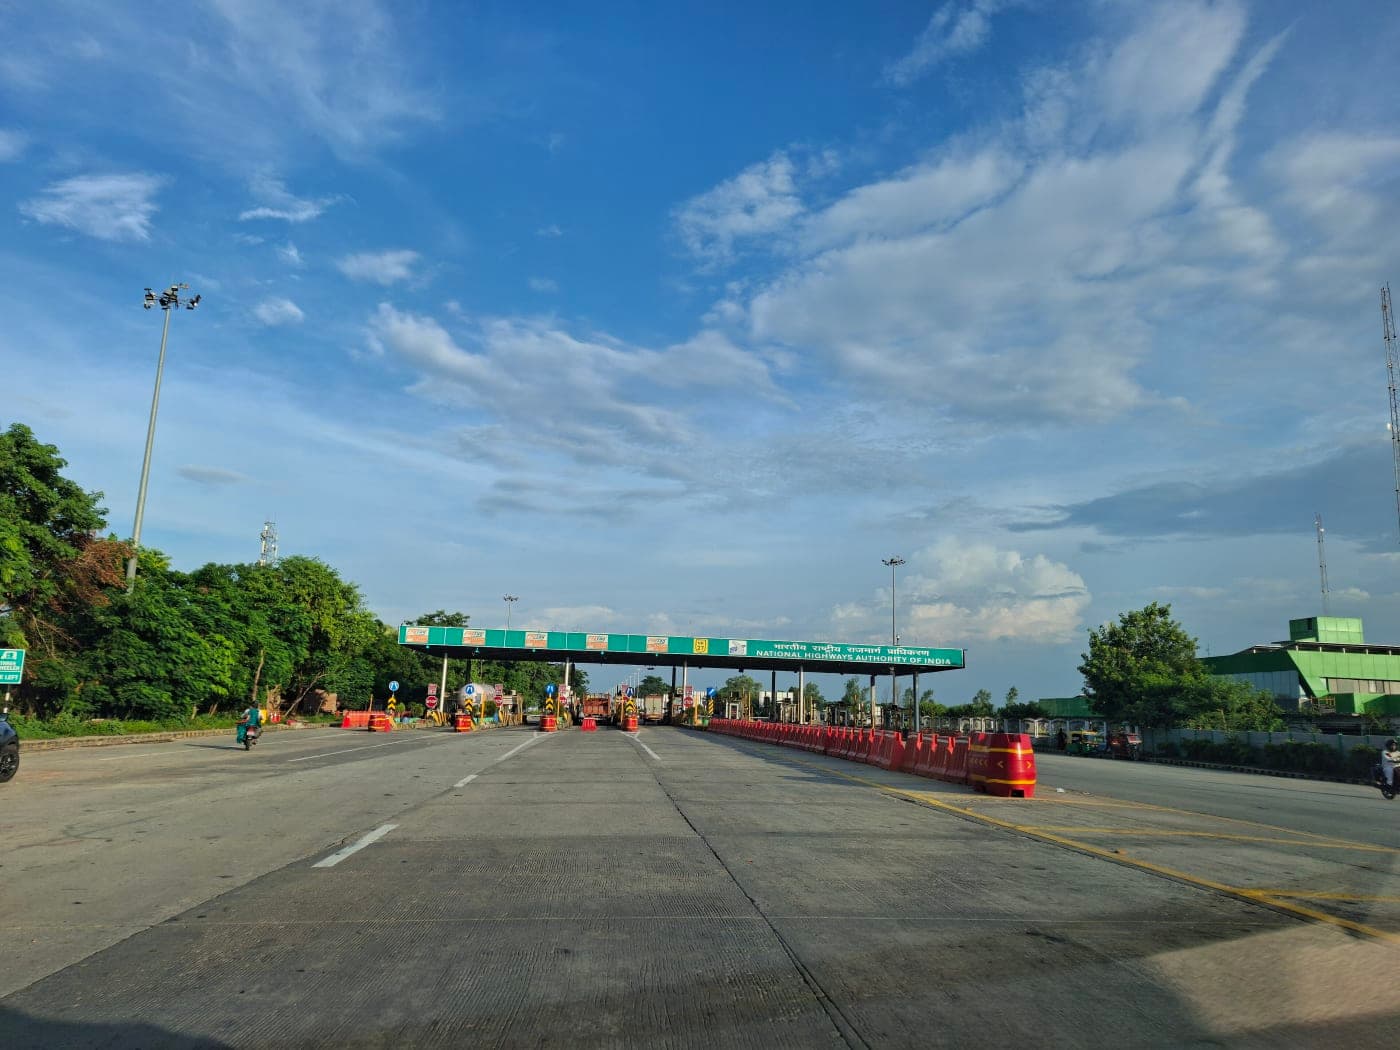
Connectivity & Transport




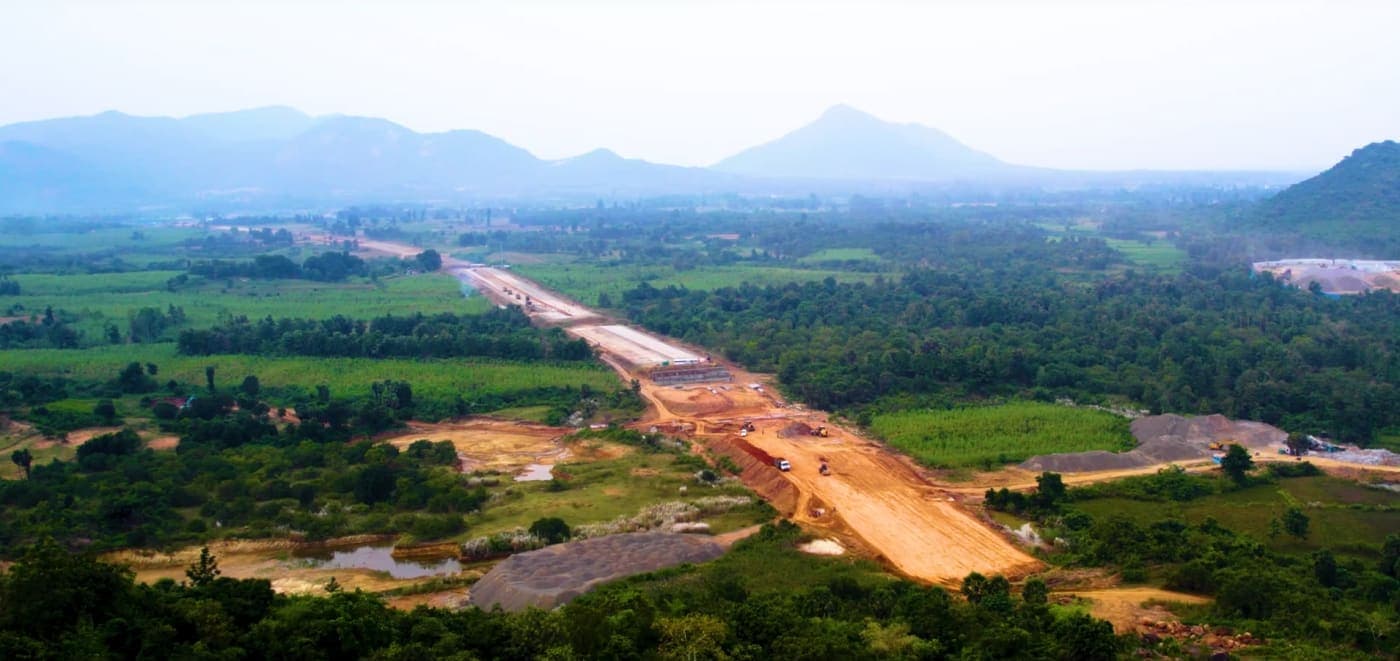




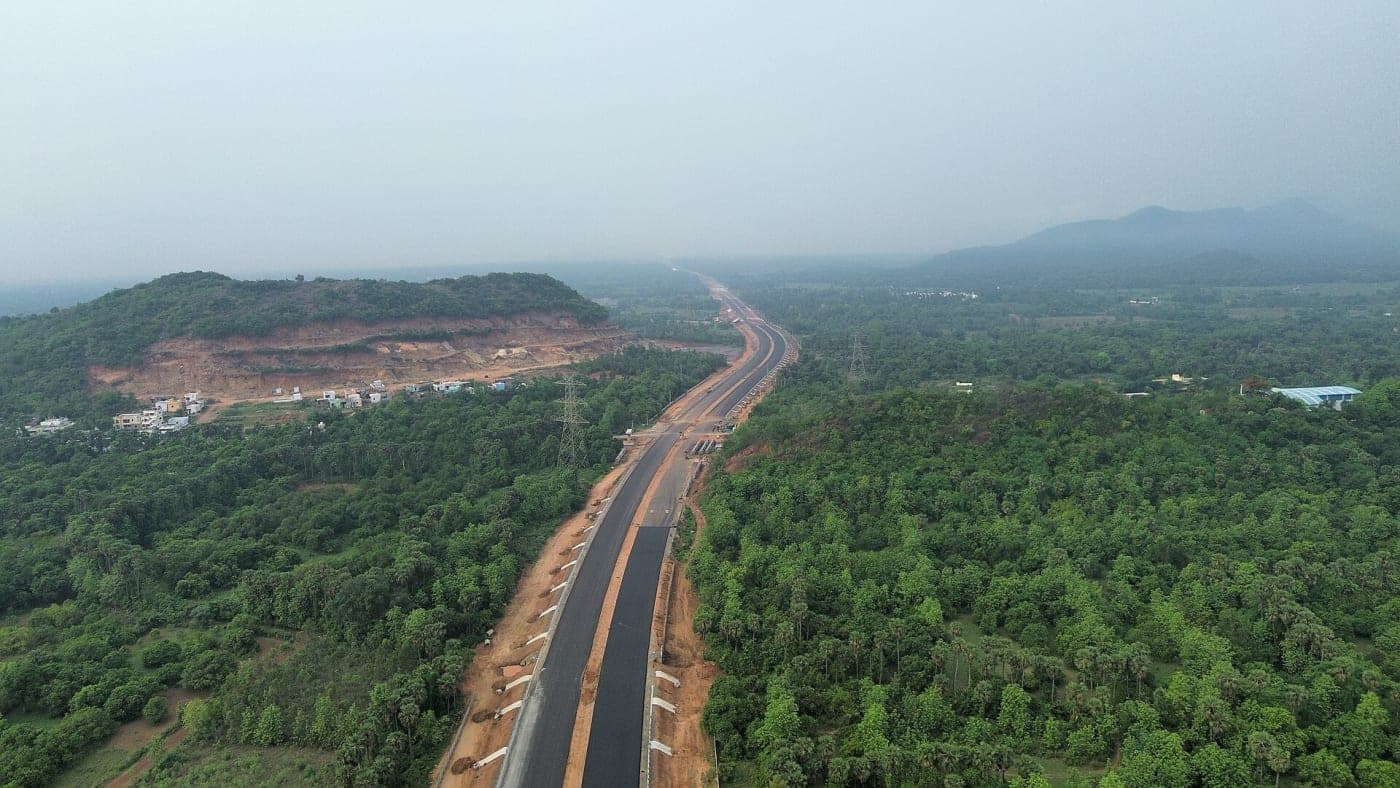
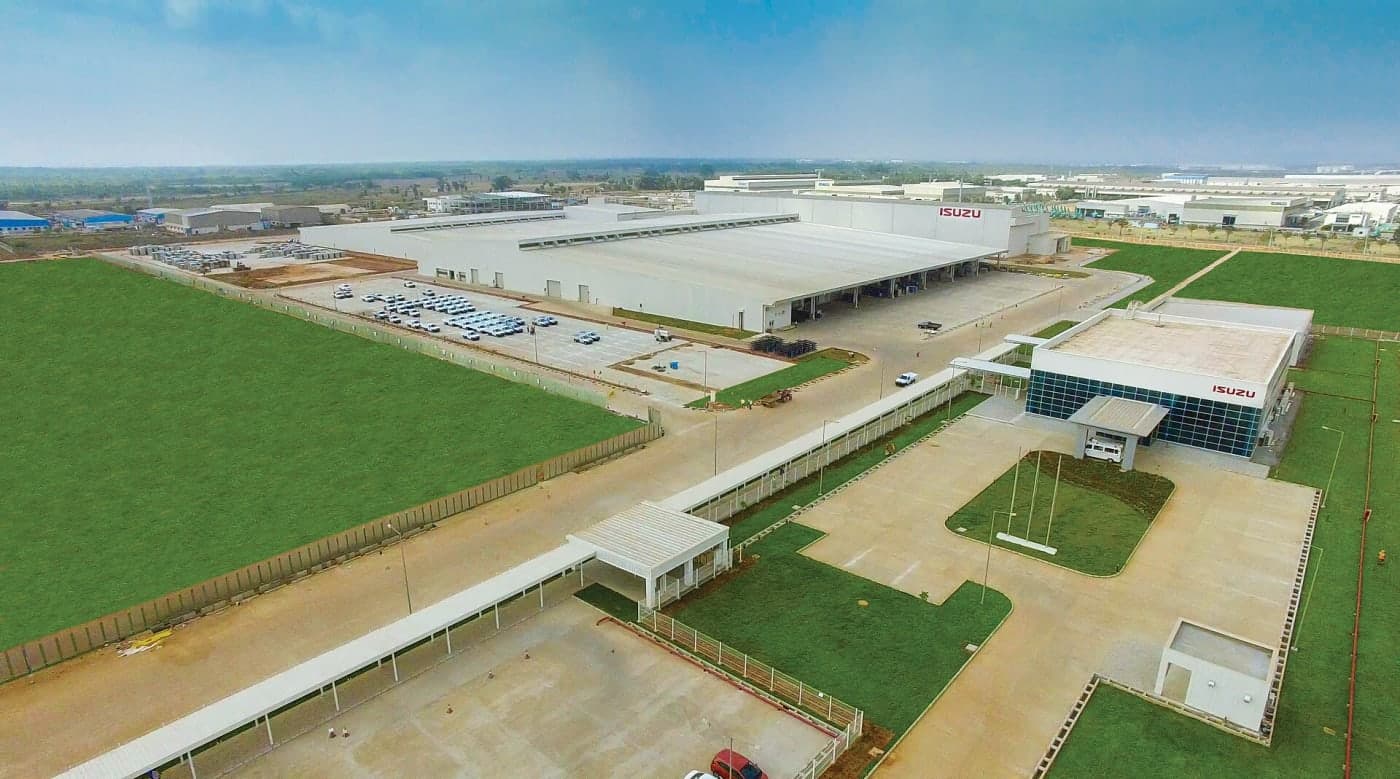






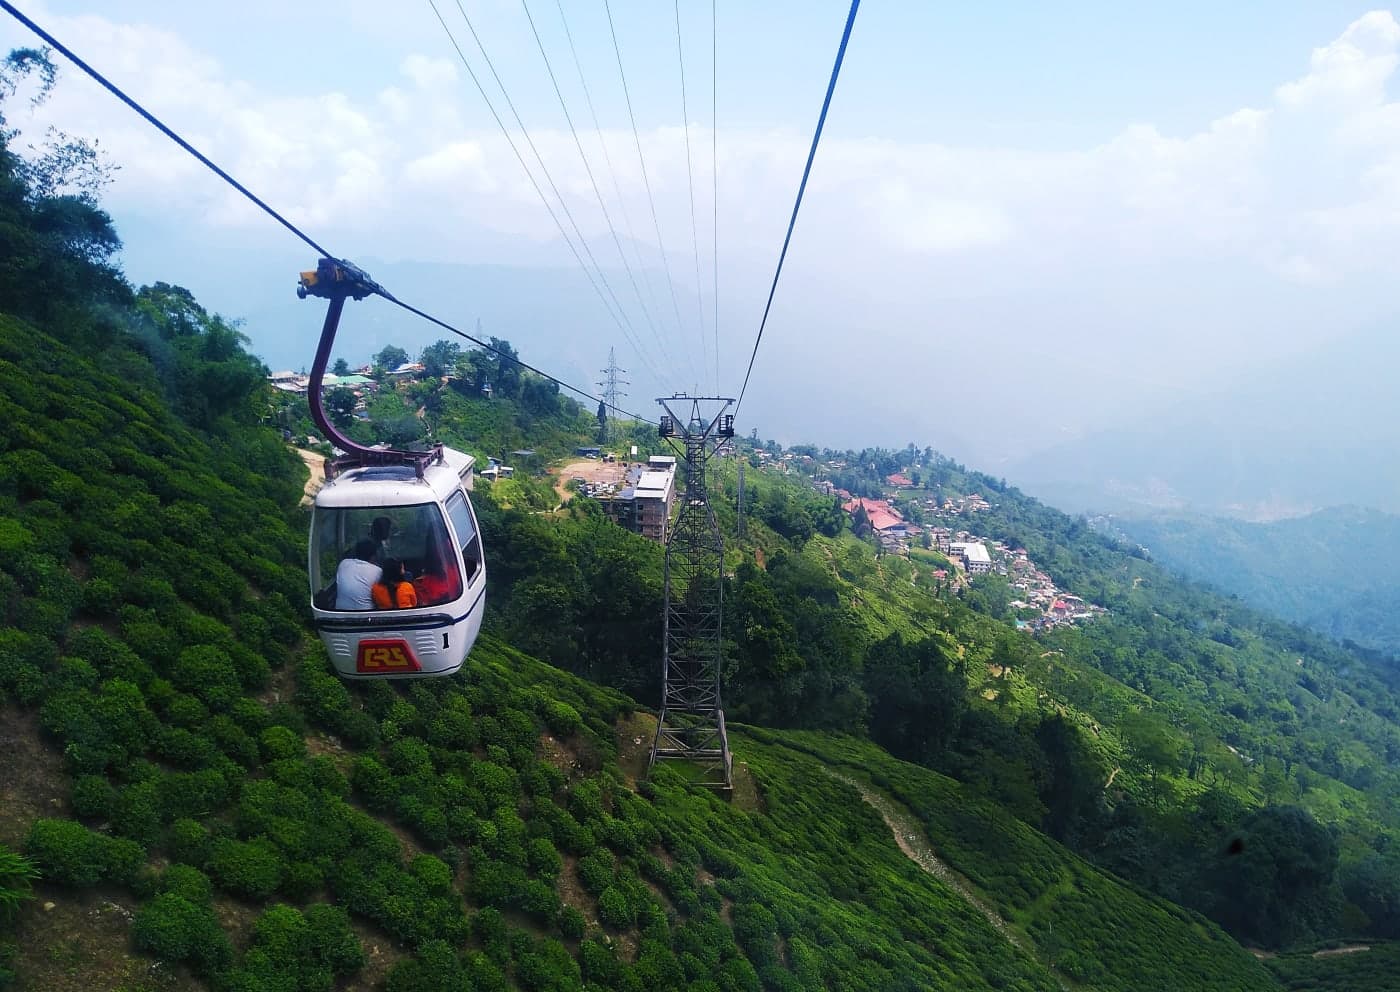



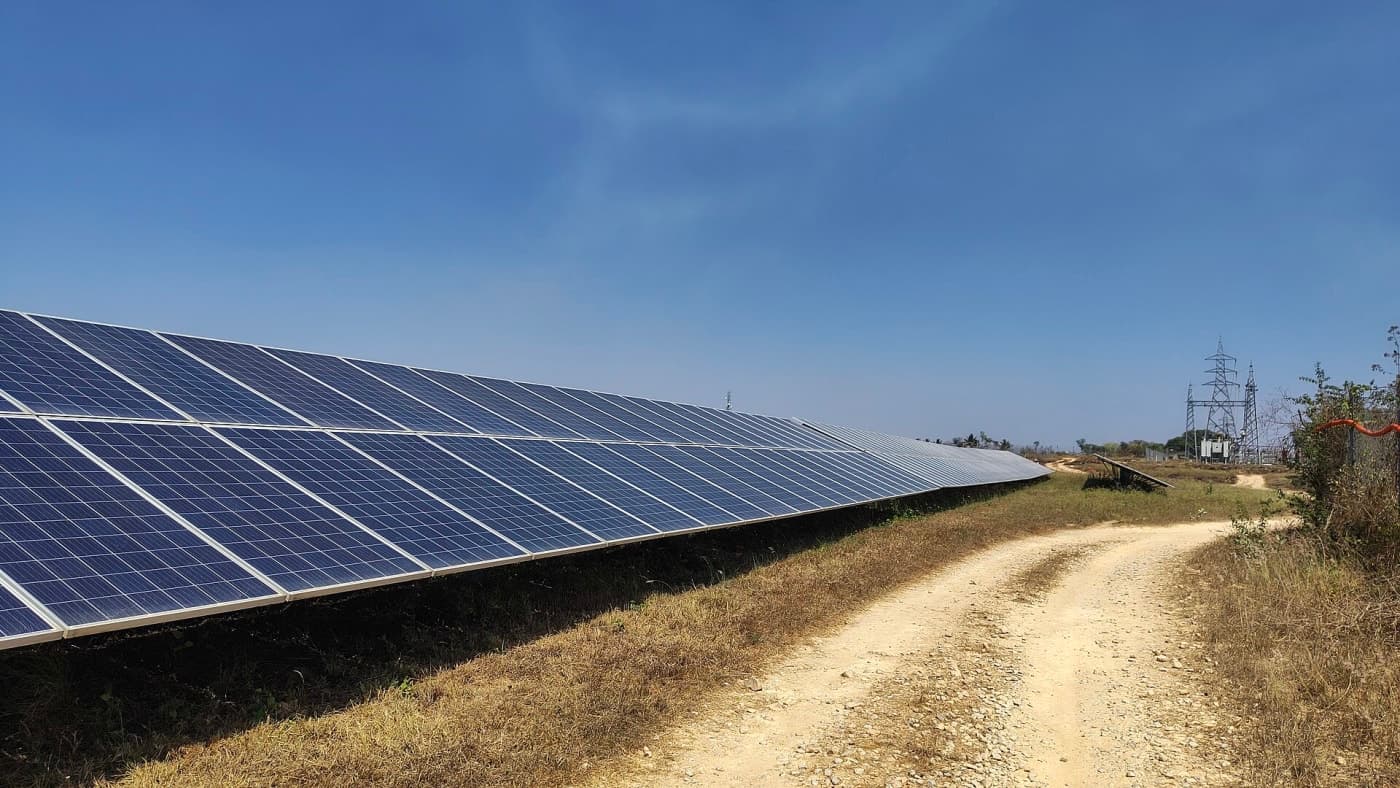
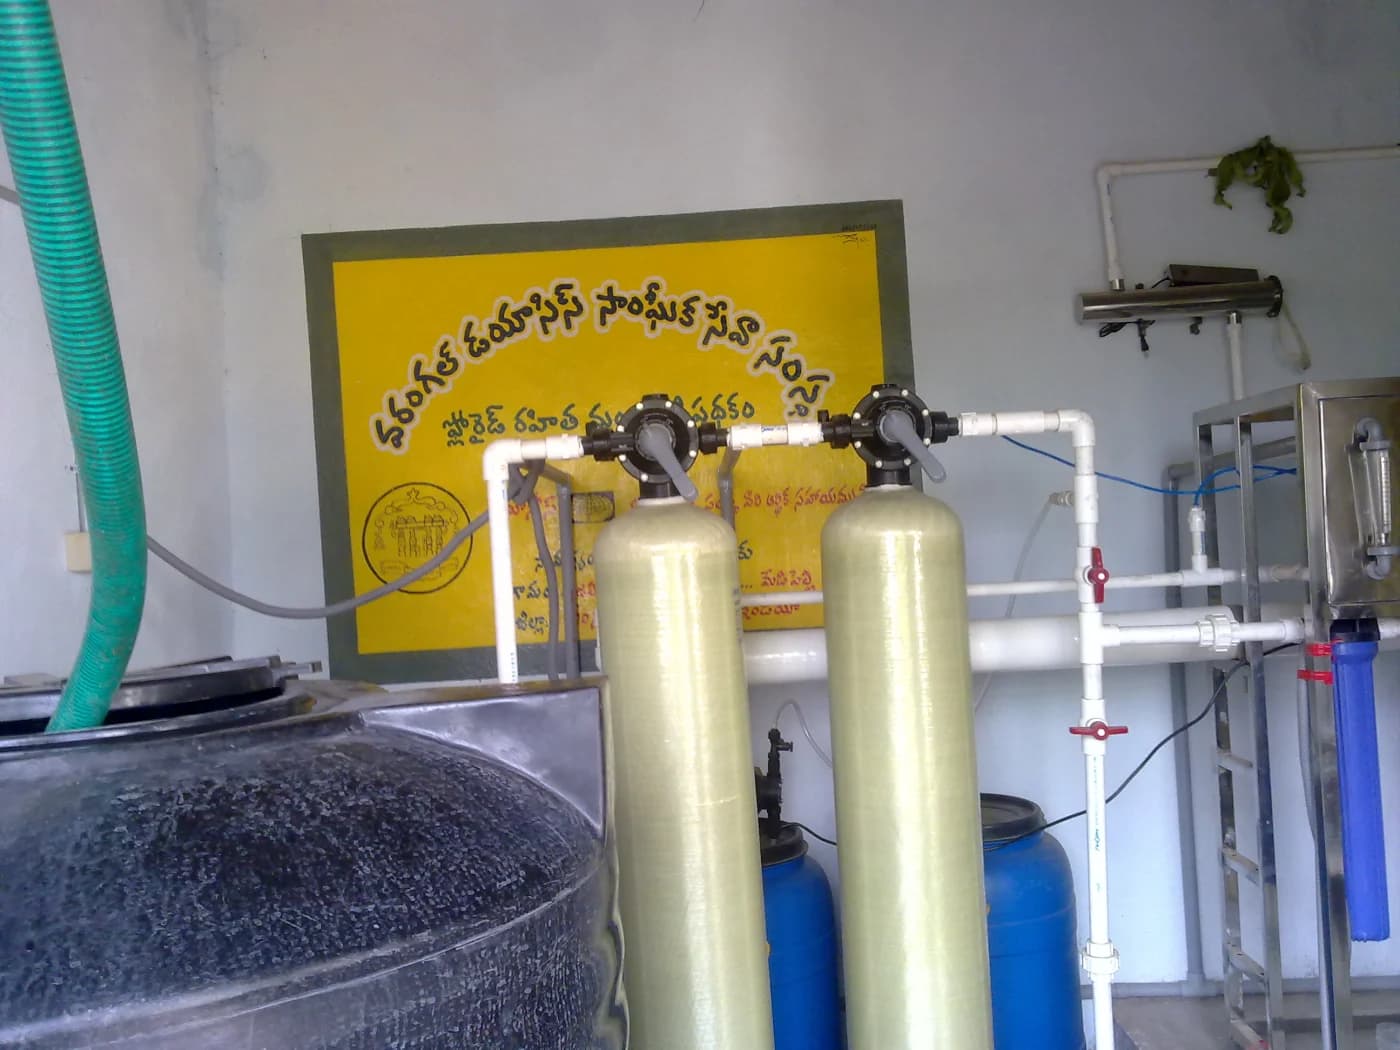
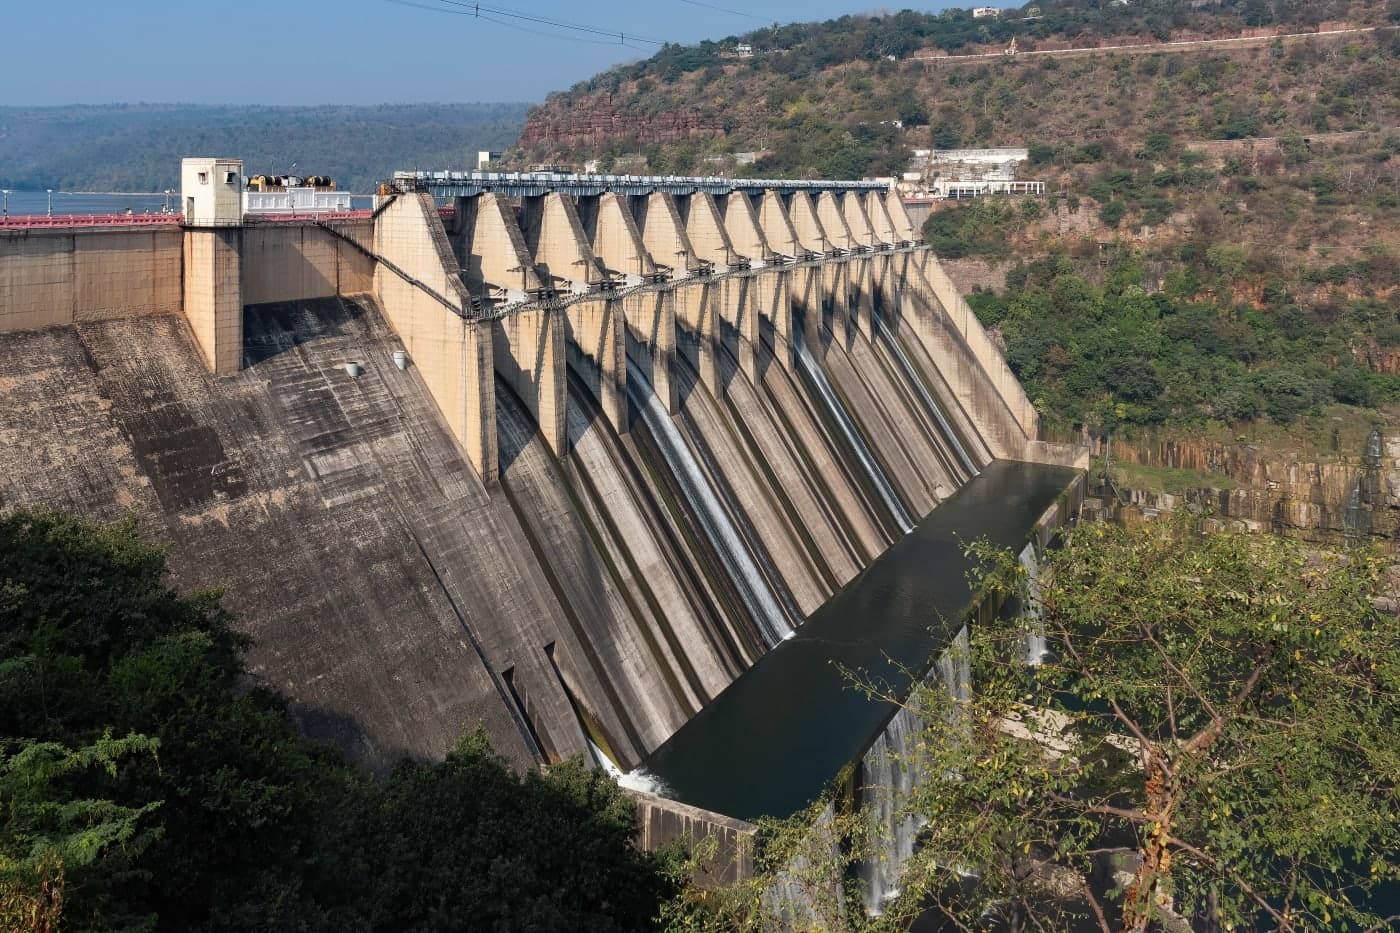
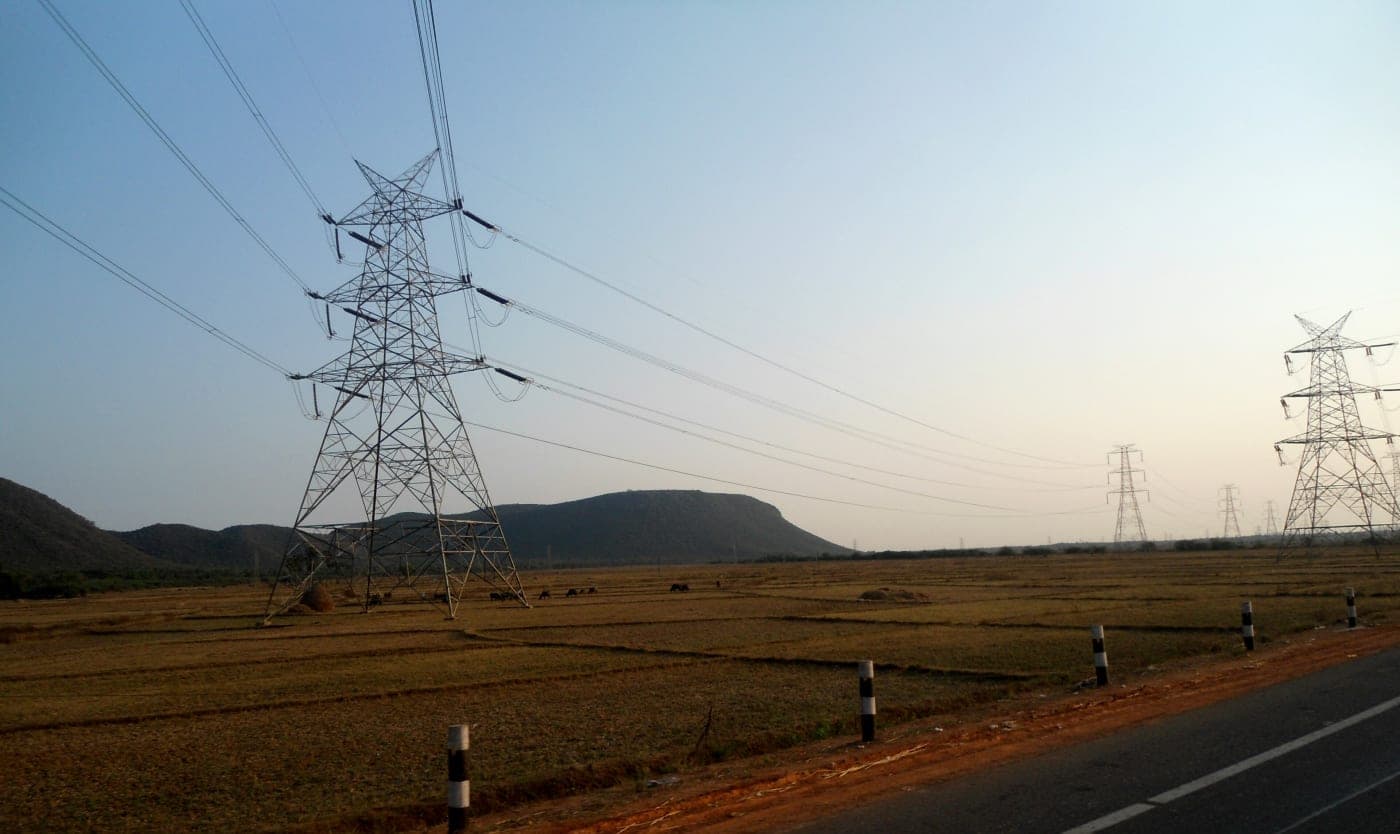
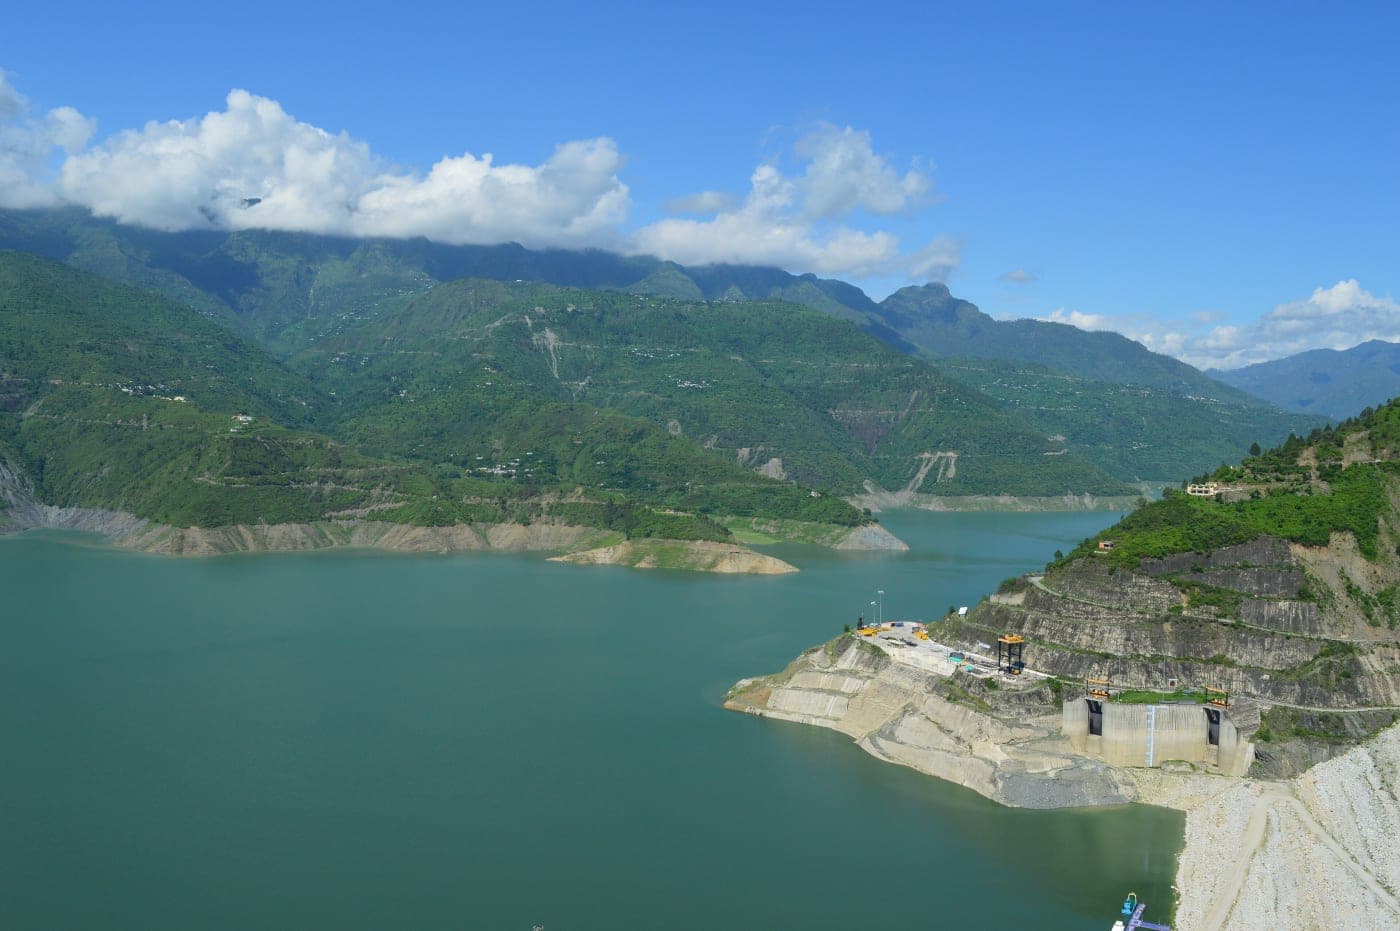
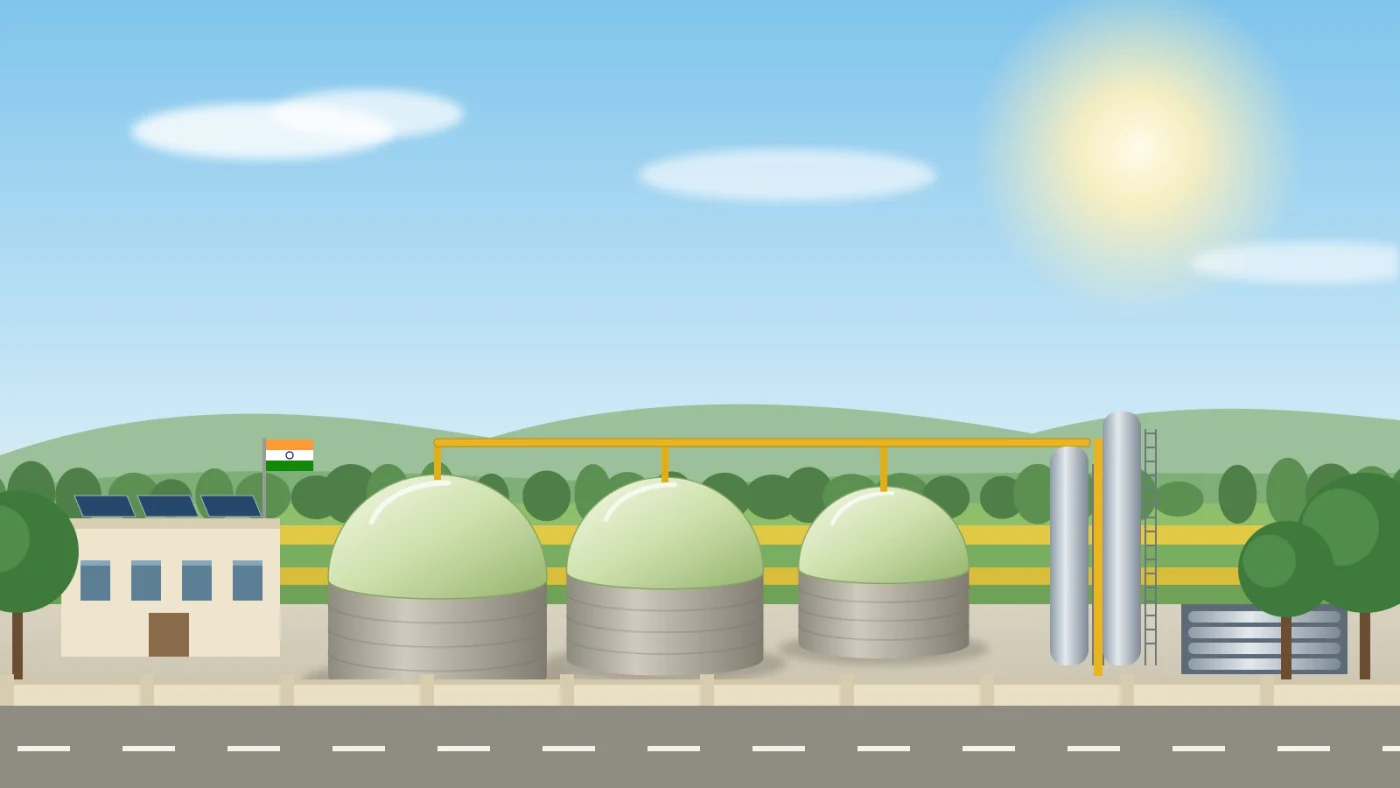
Water, Energy & Environment













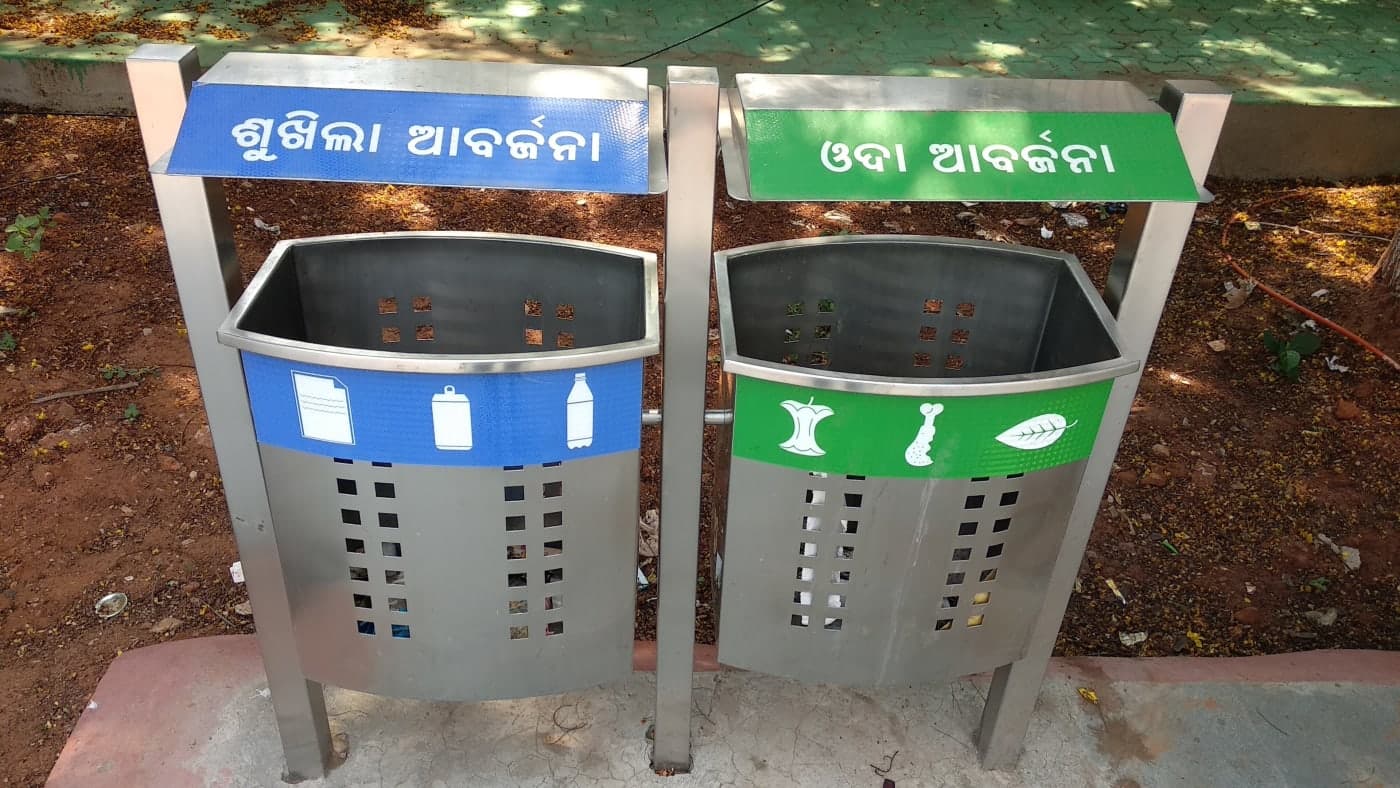


Digital & Economy
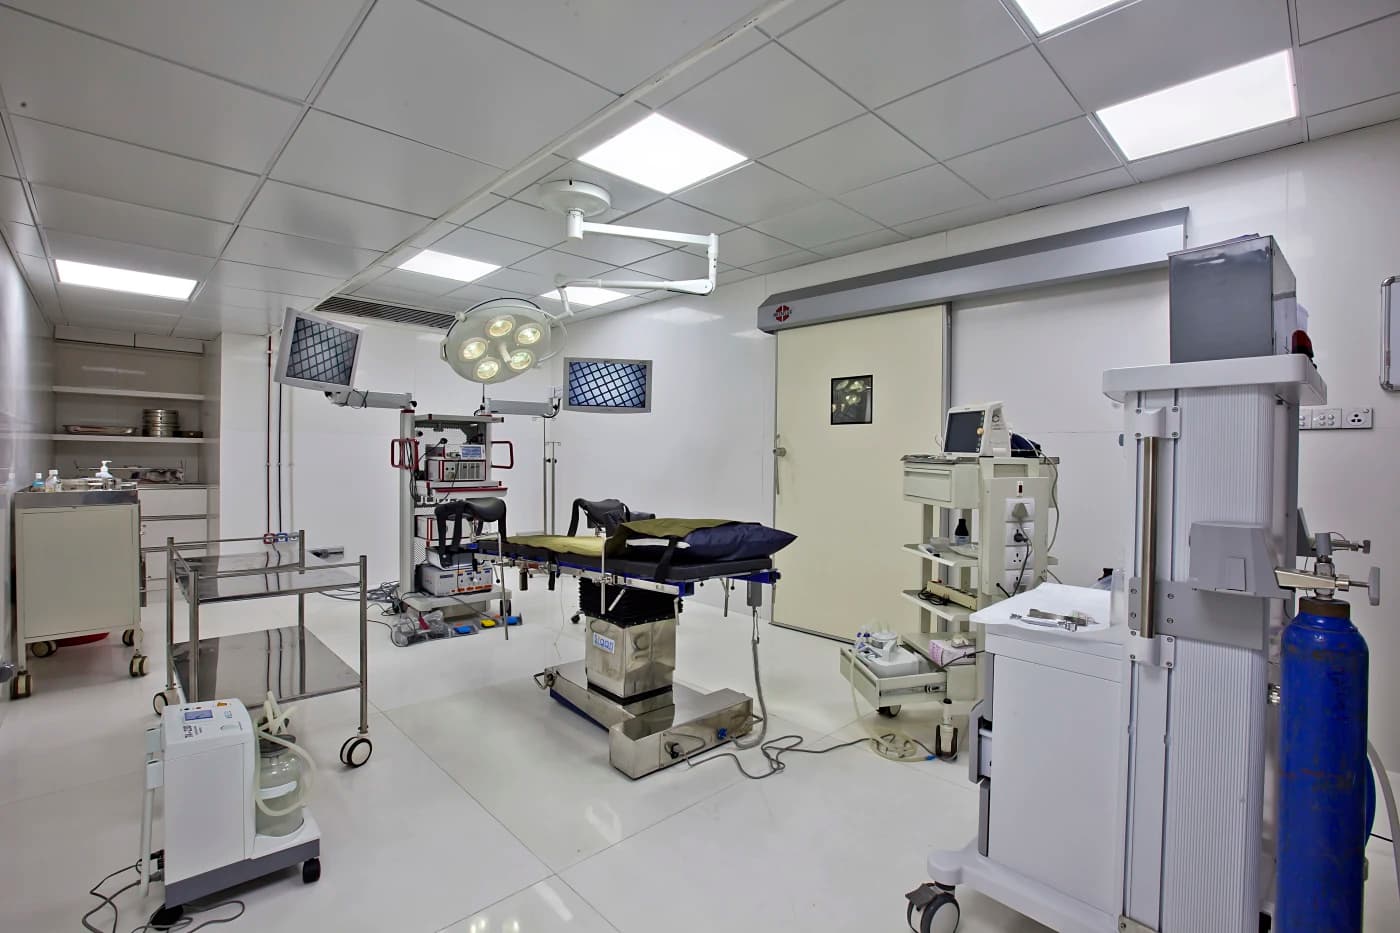

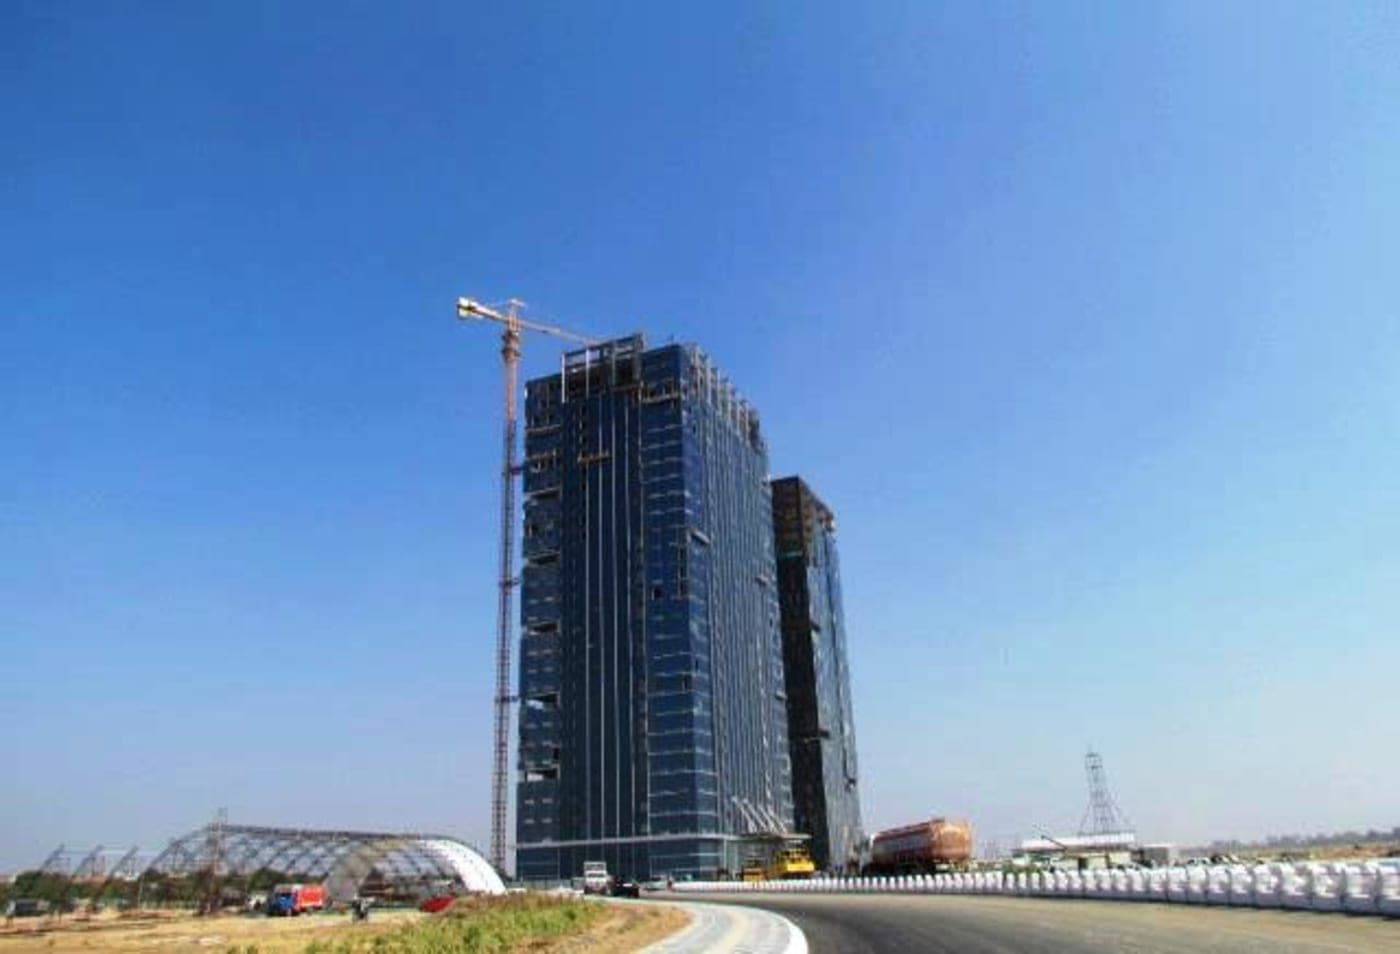
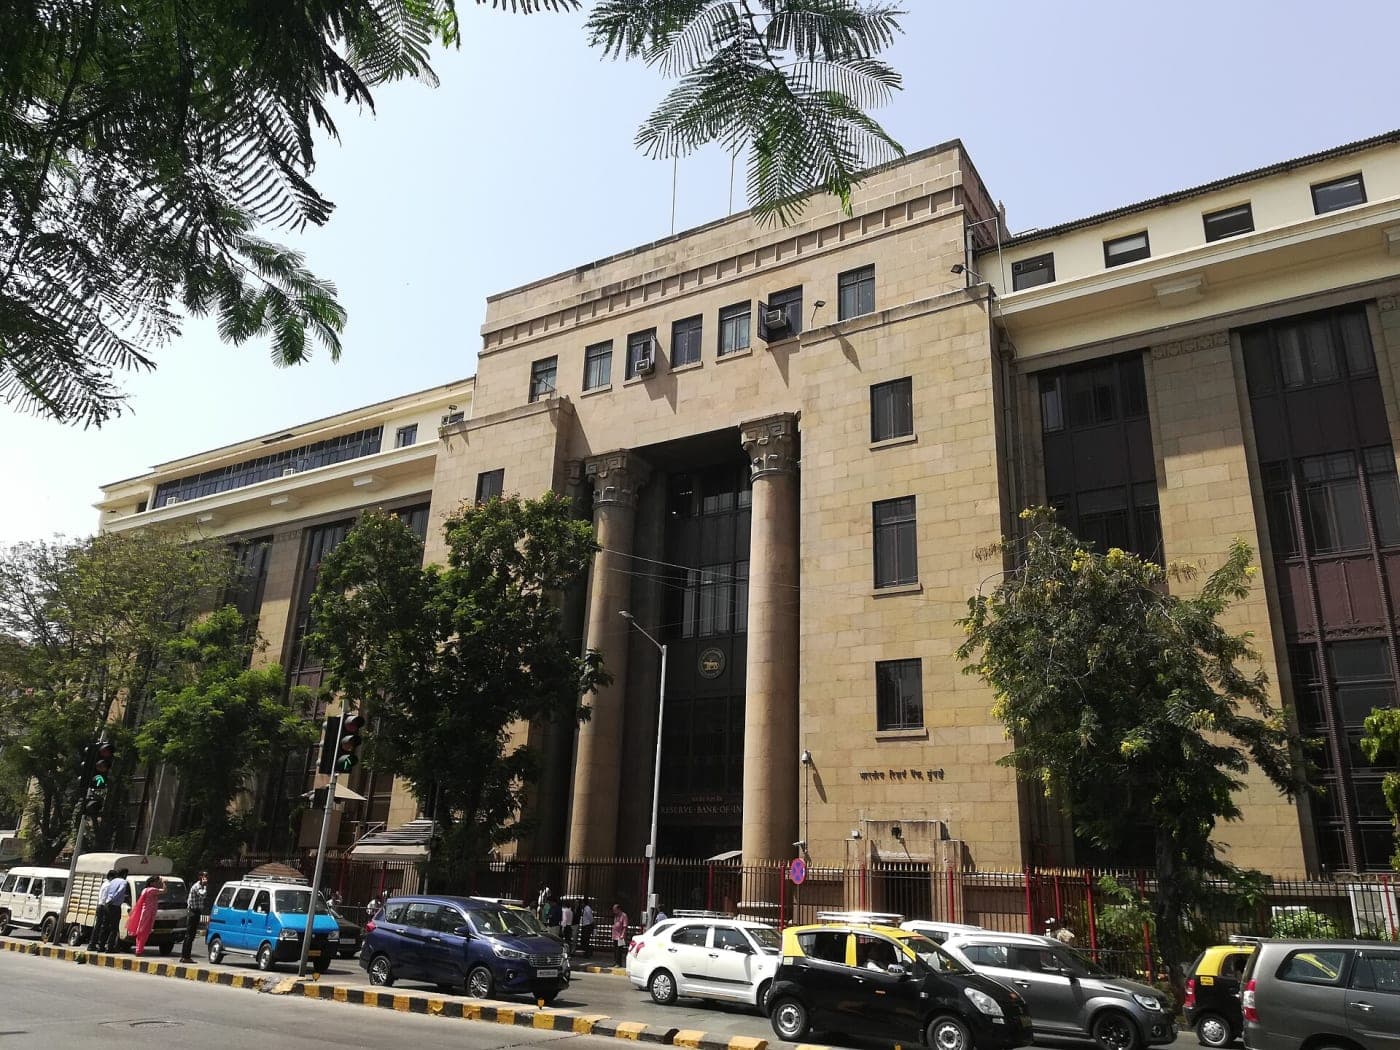






















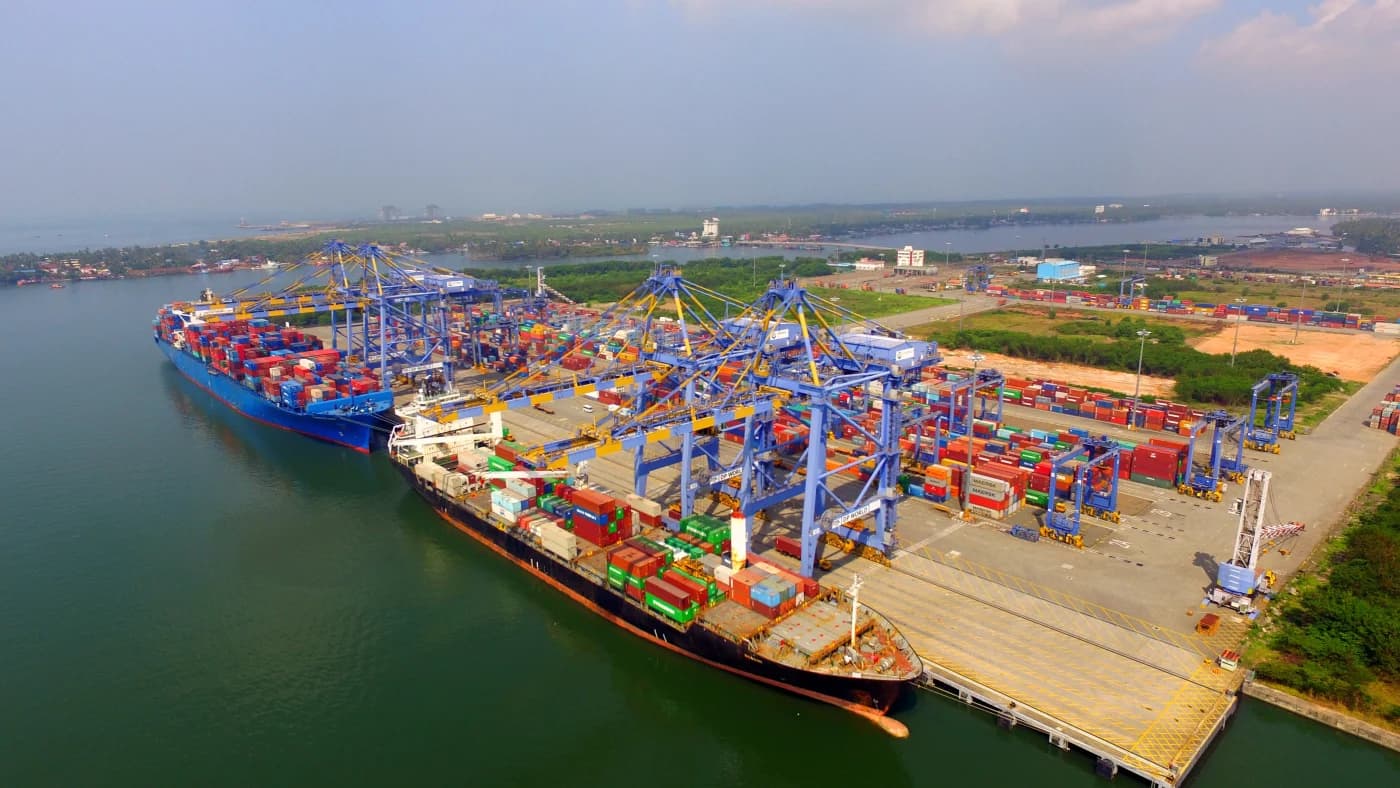
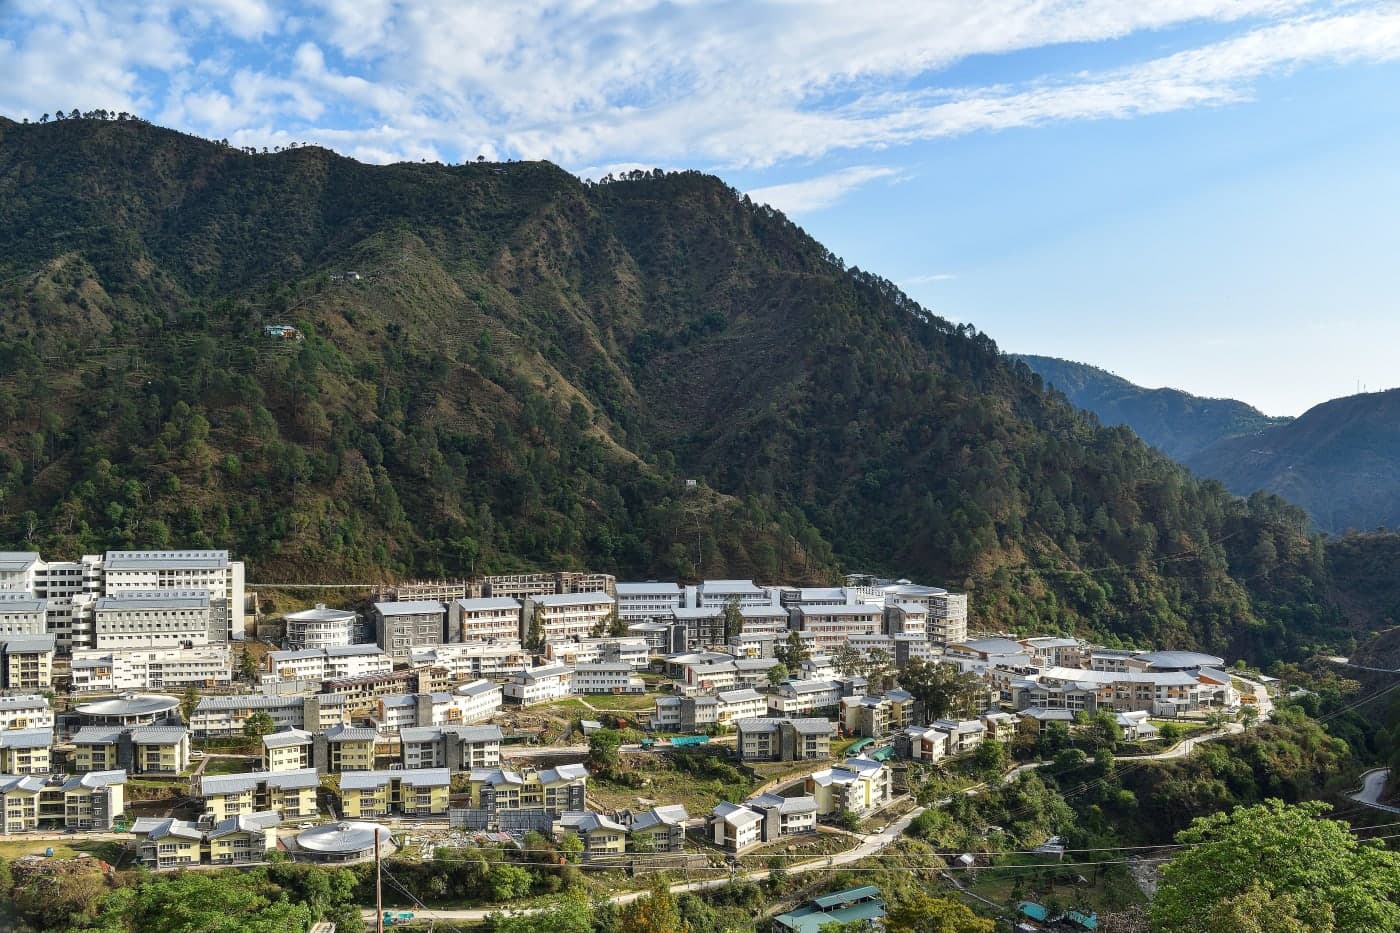

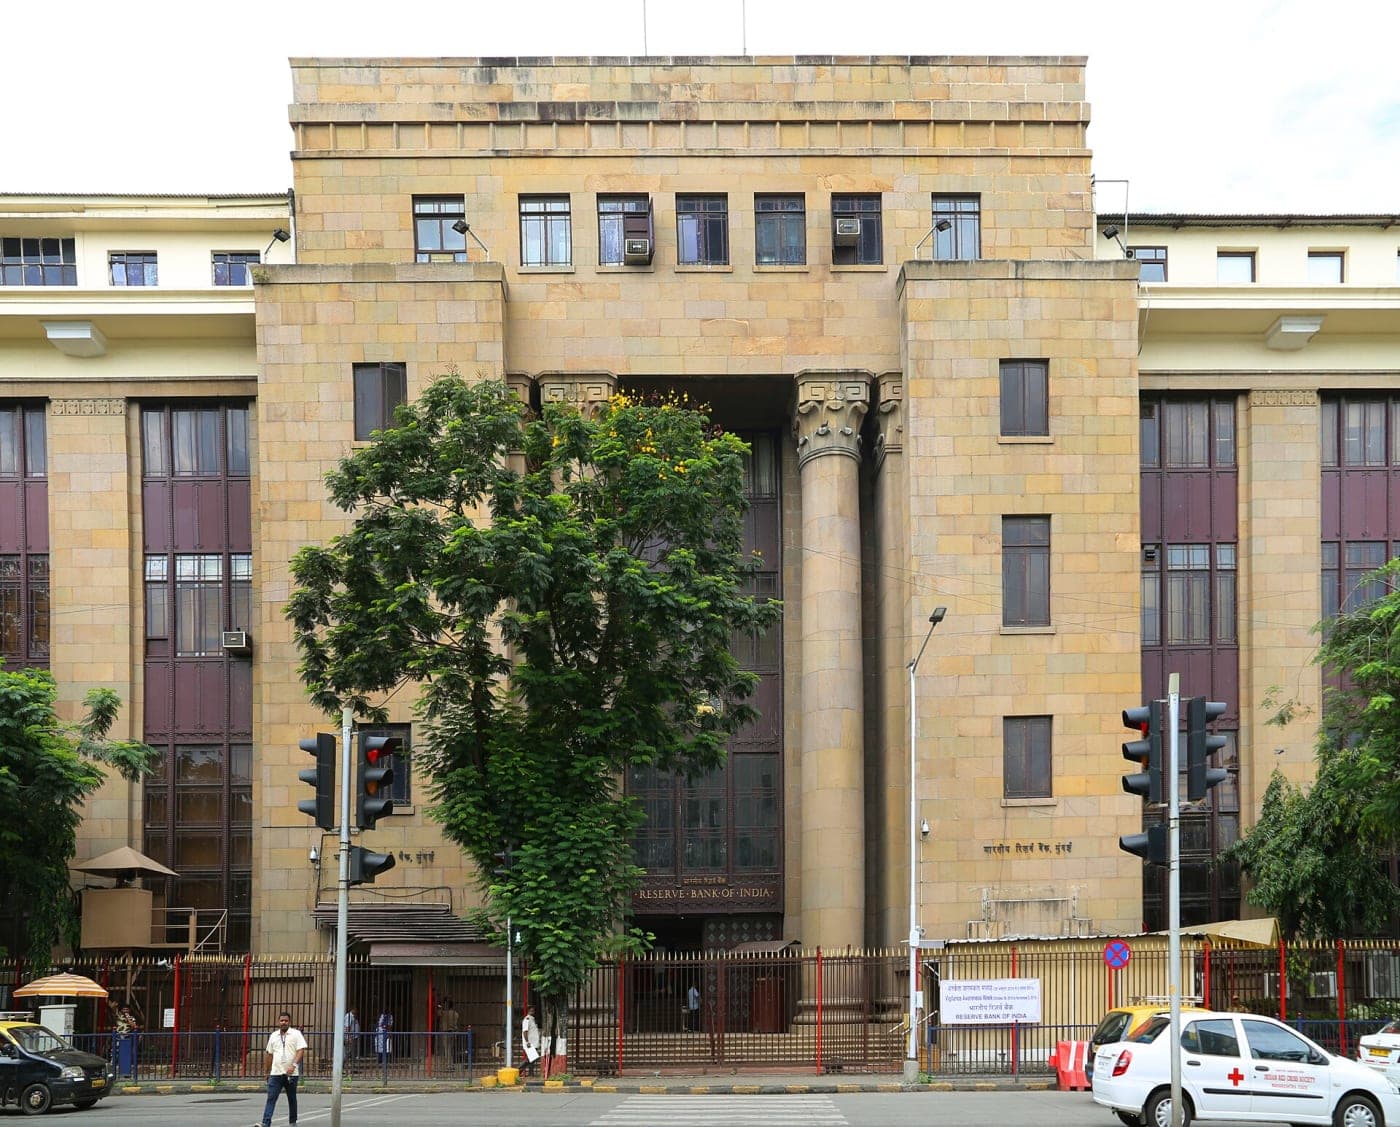







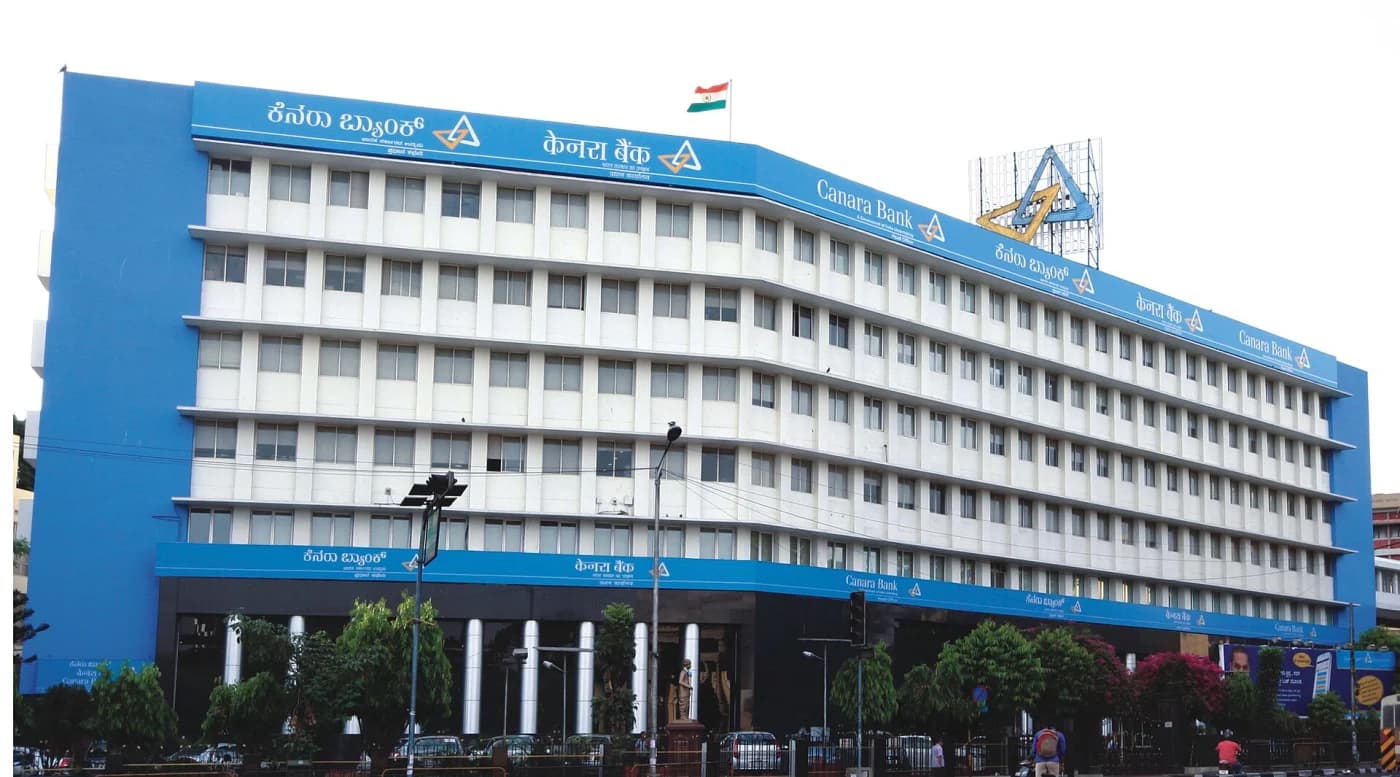
















People & Nation



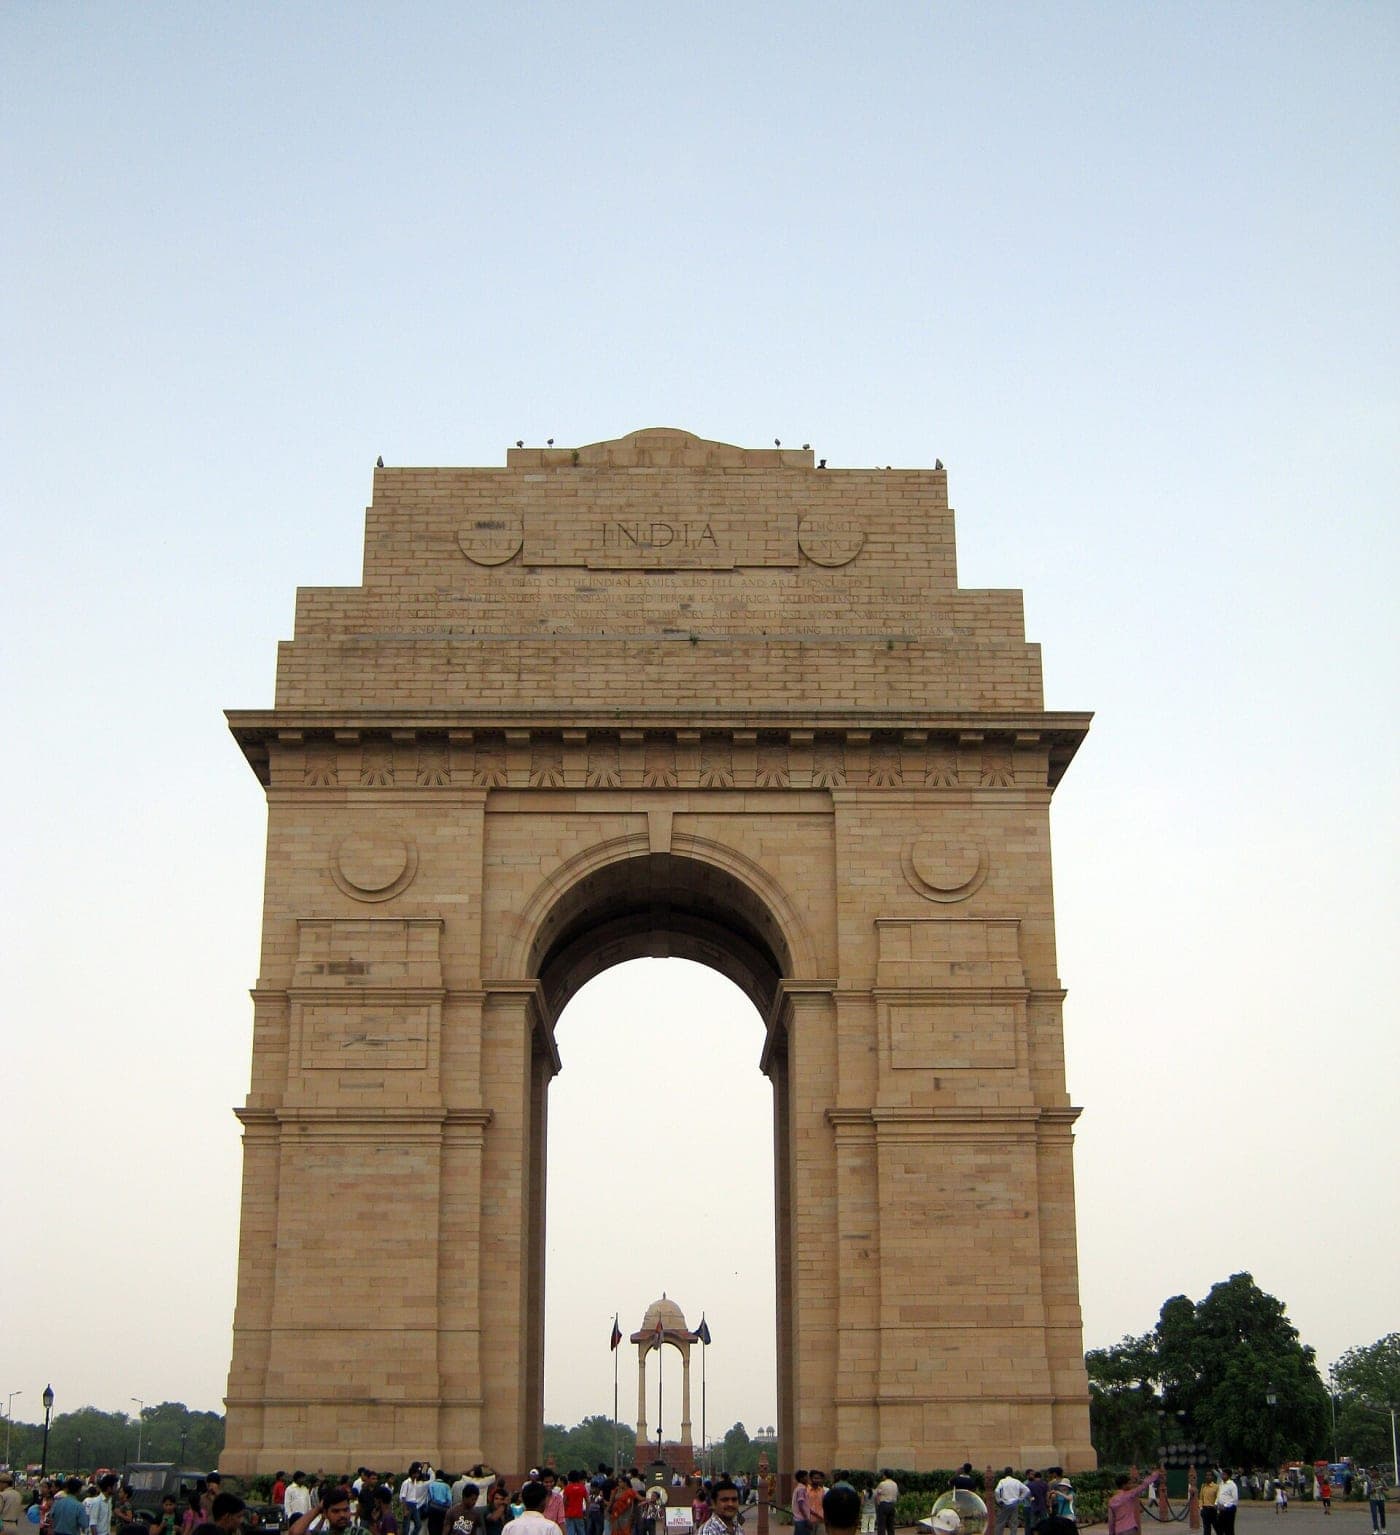
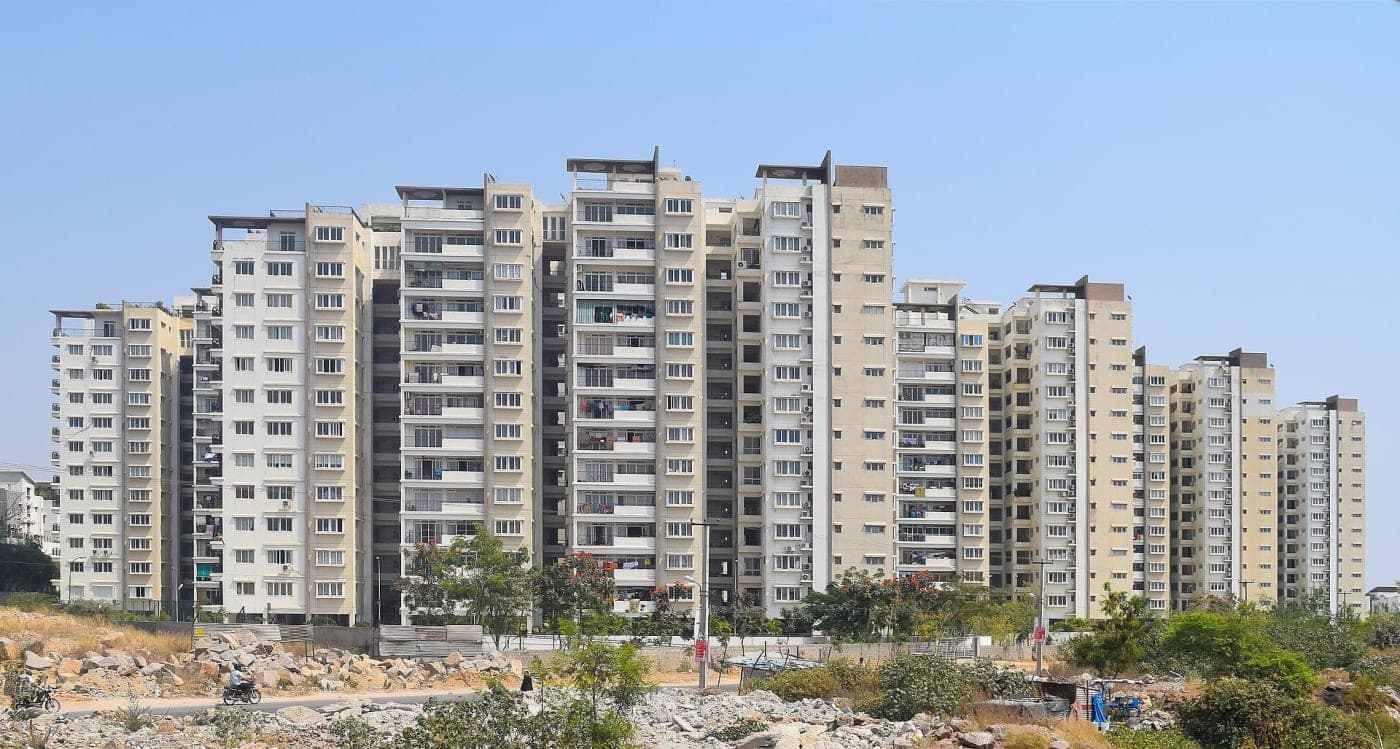
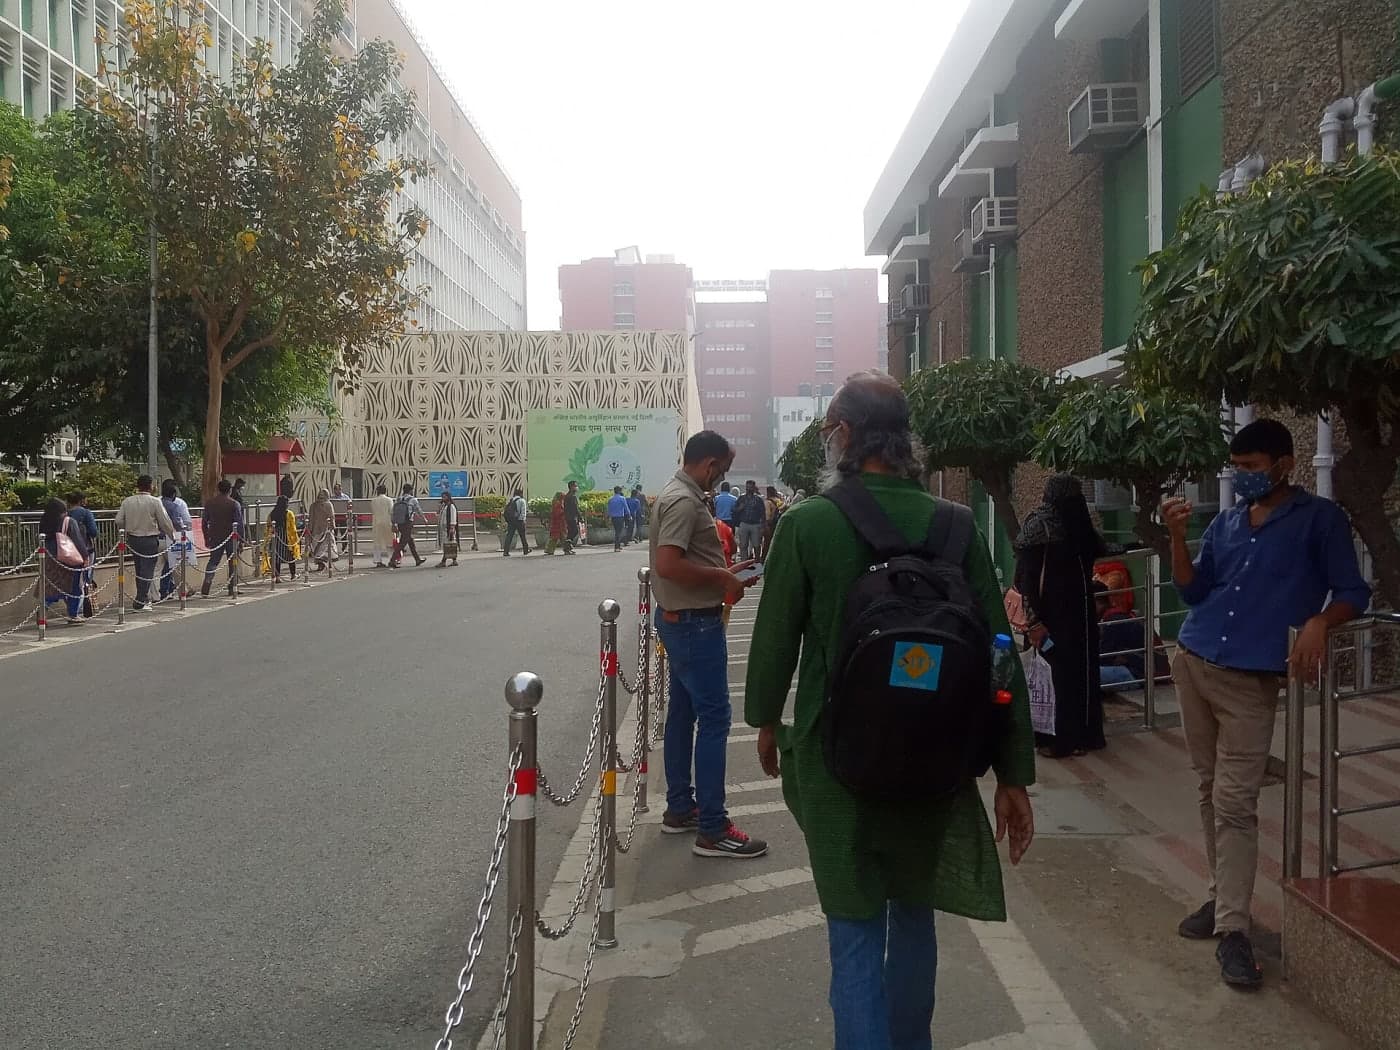


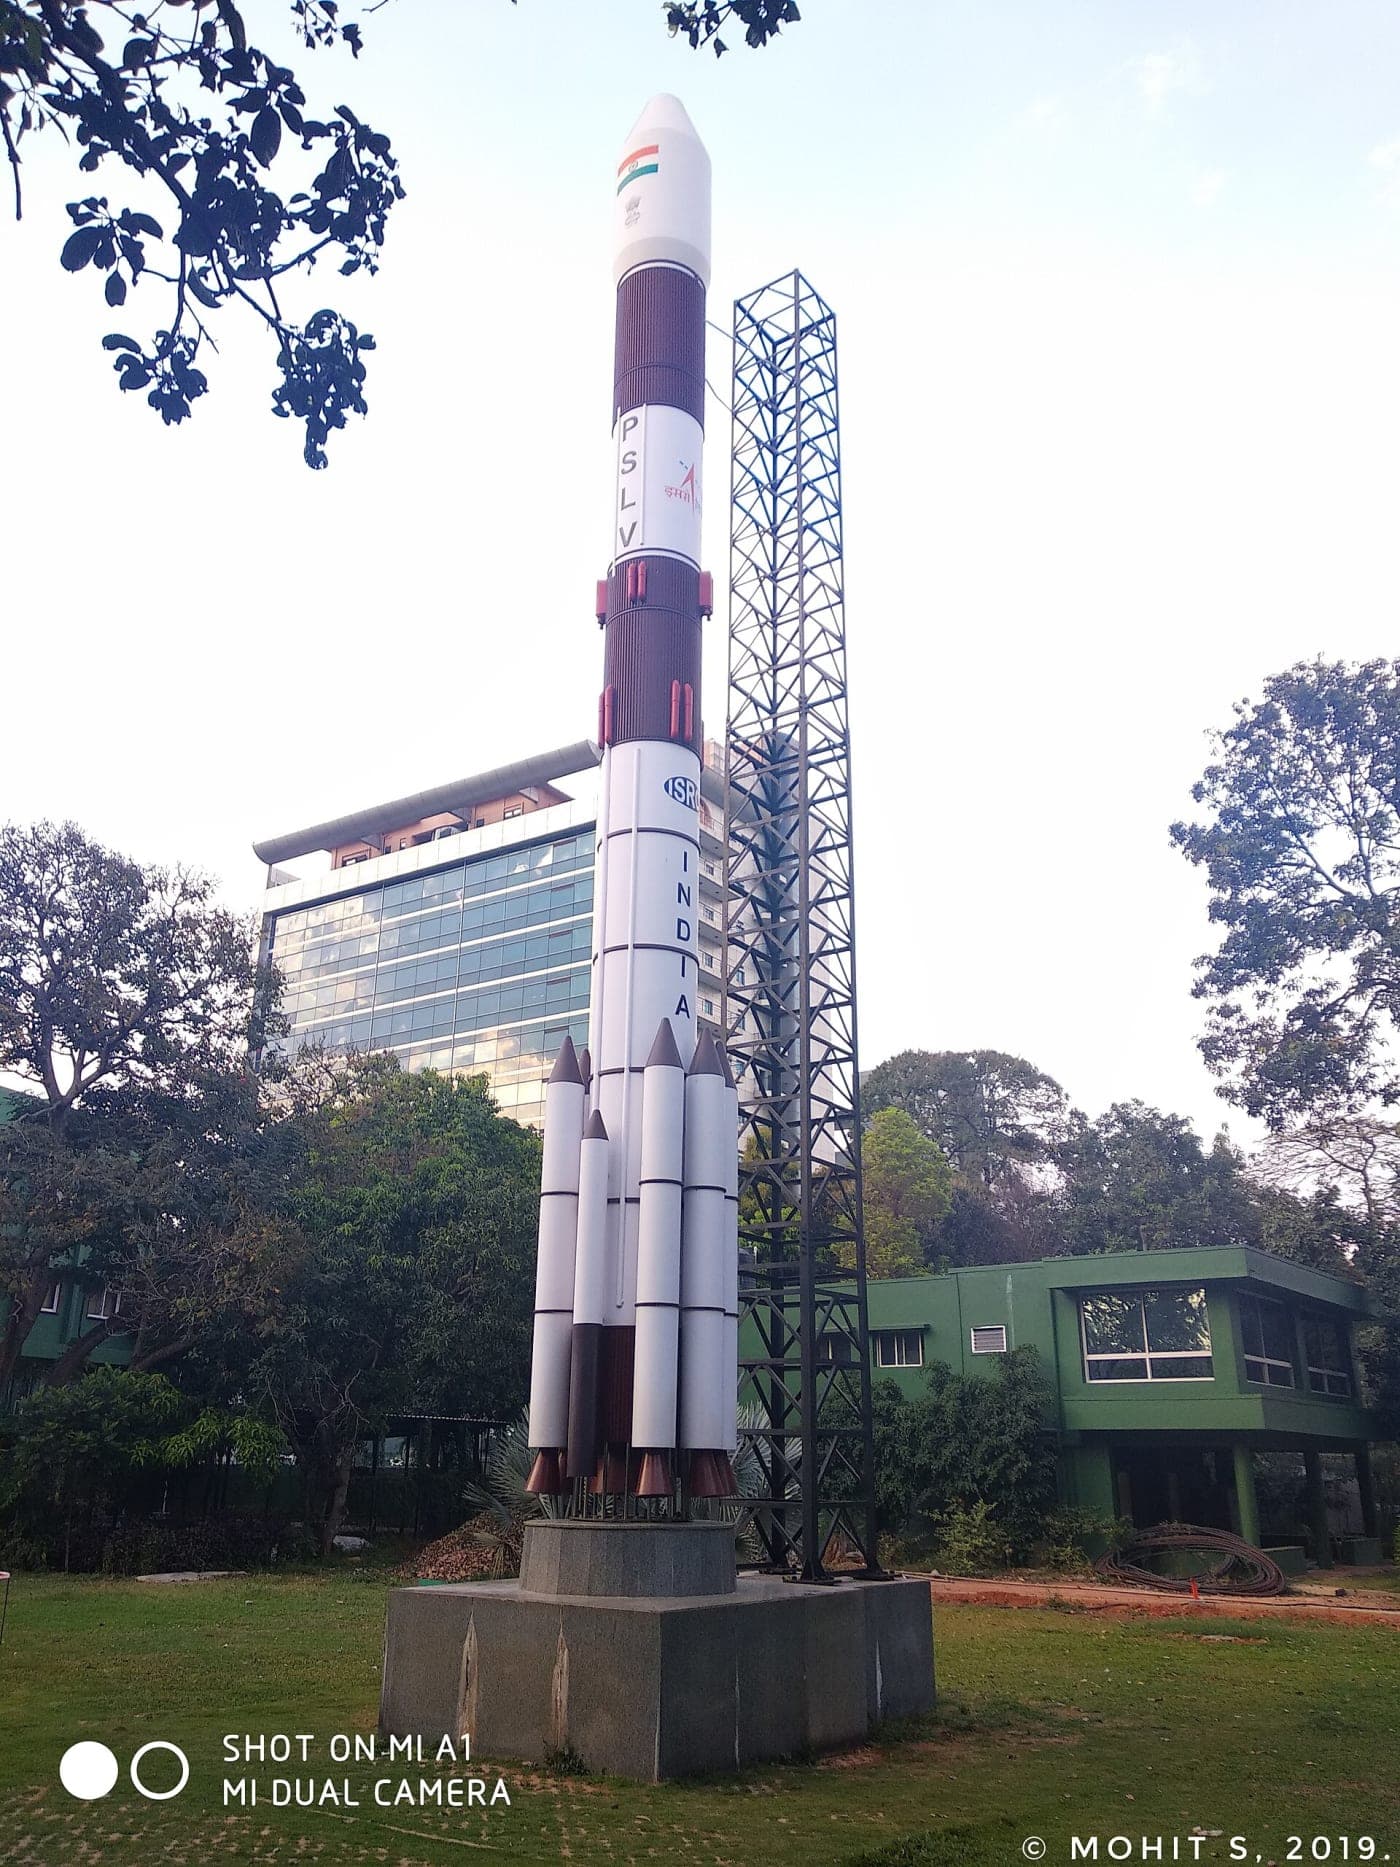


























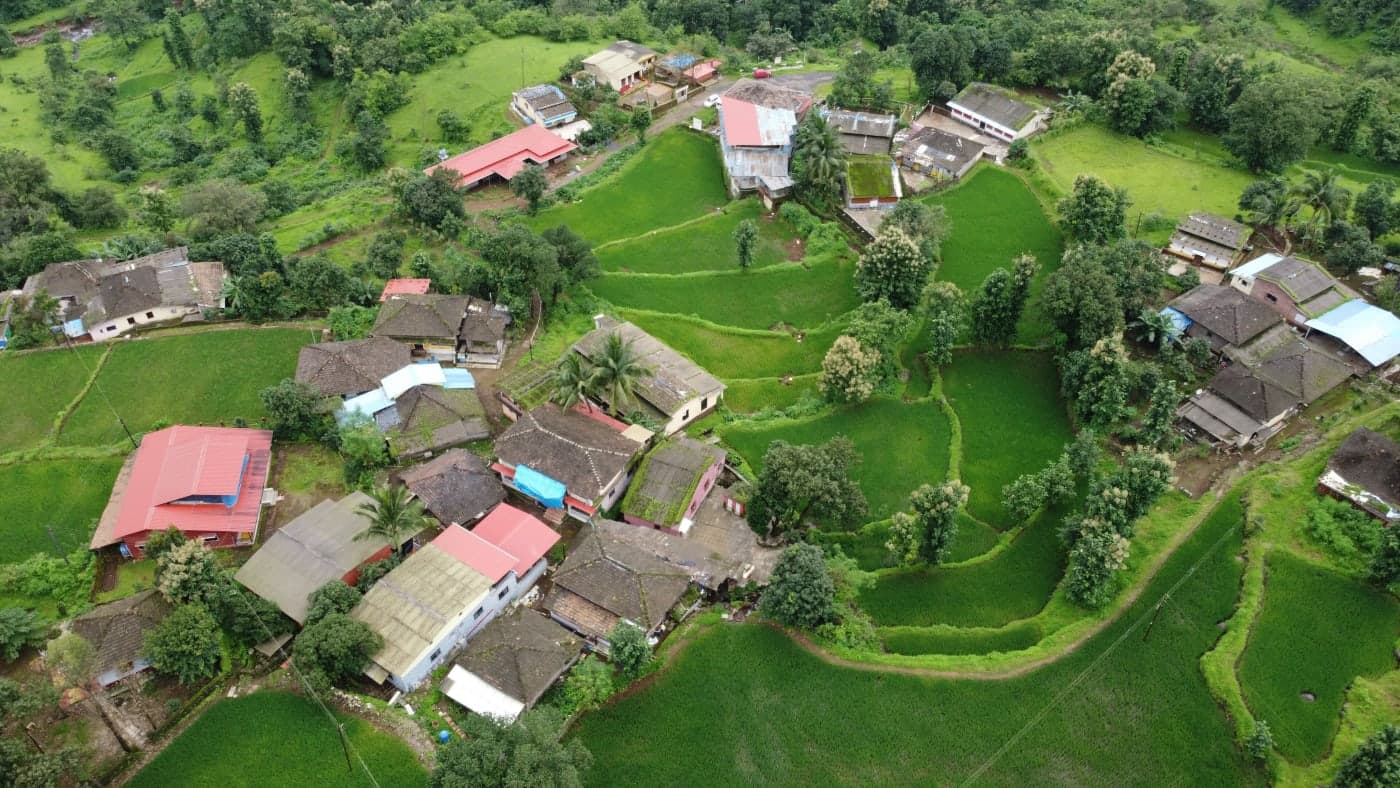

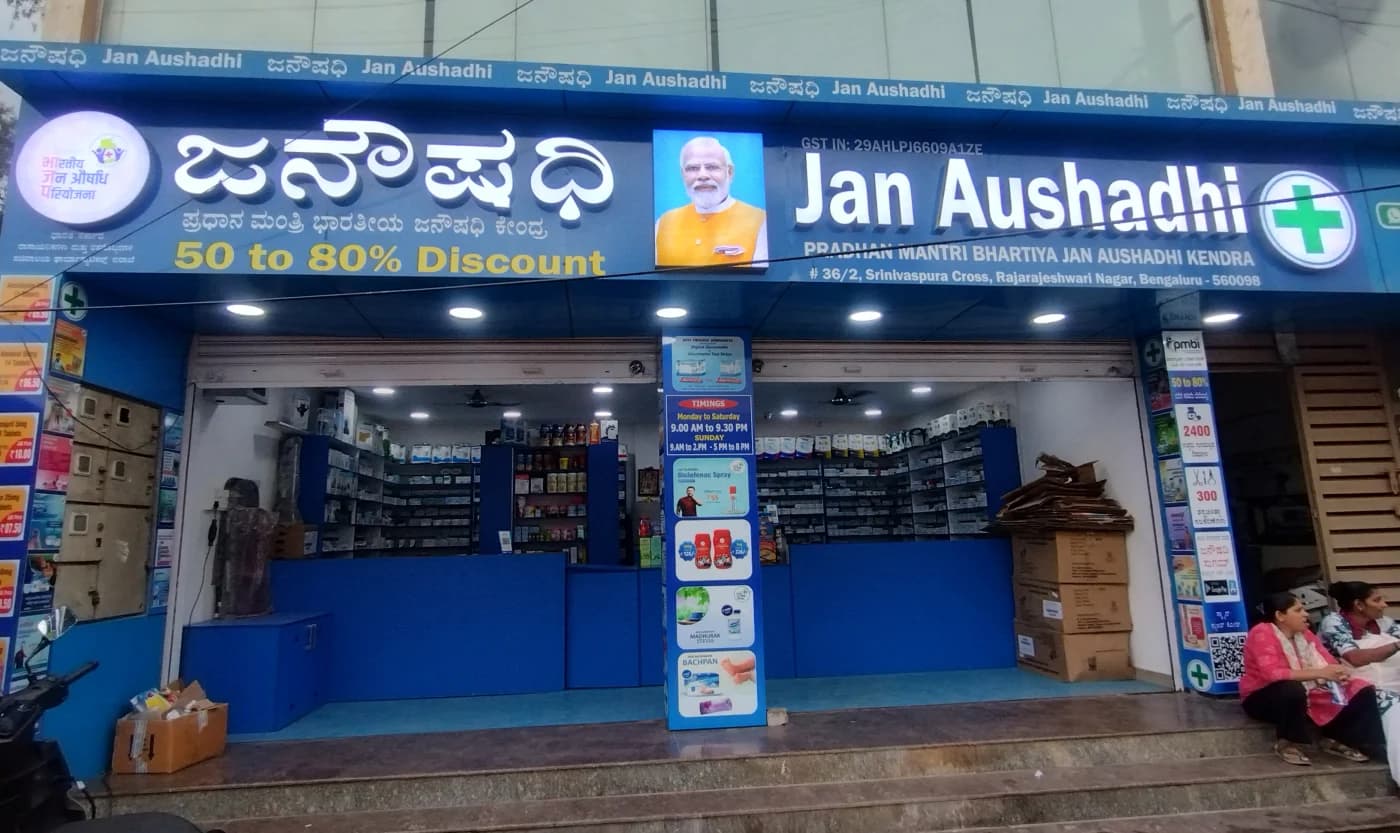





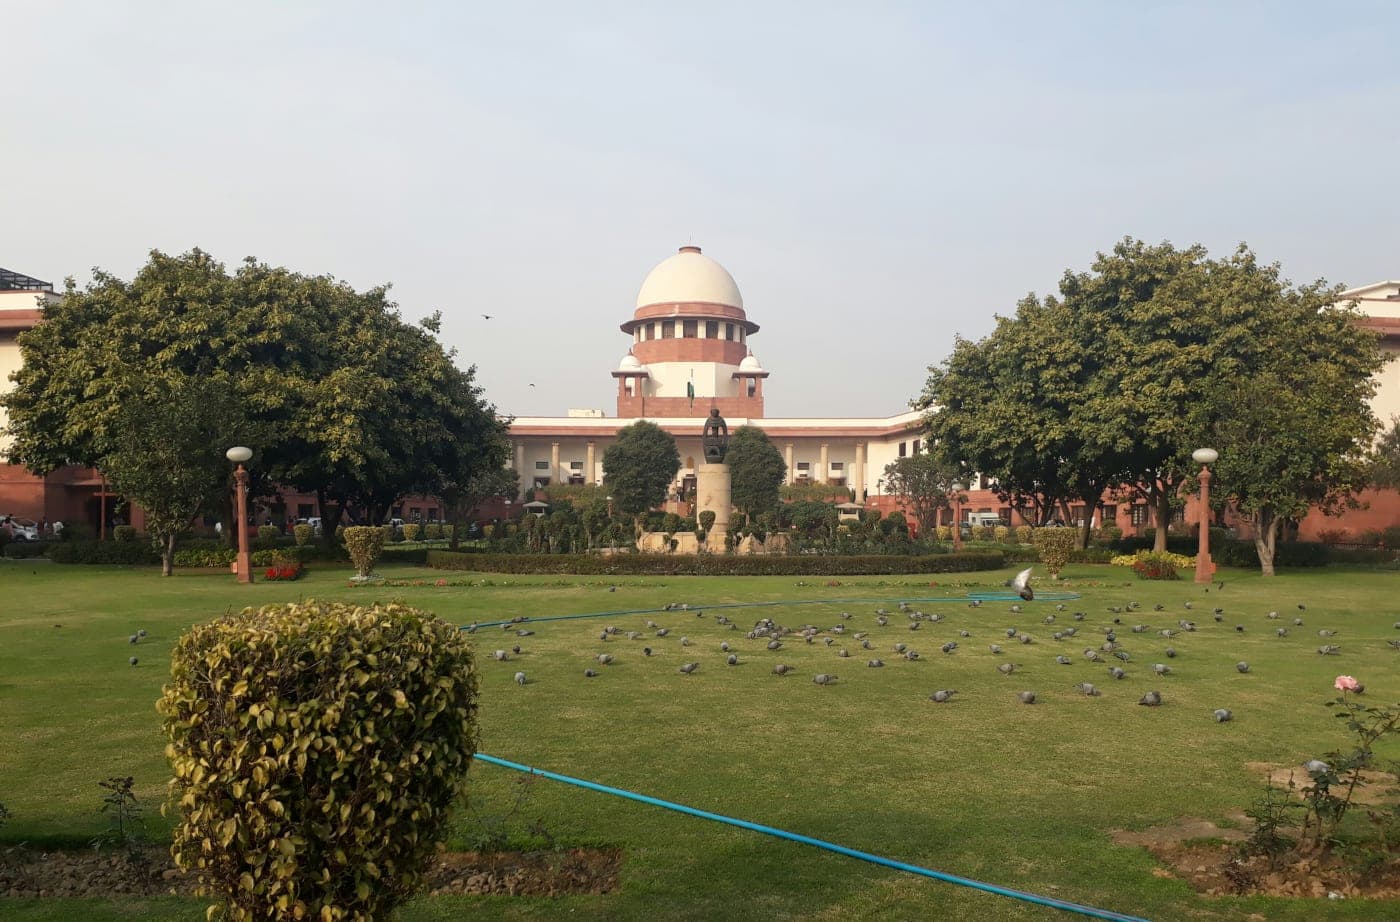



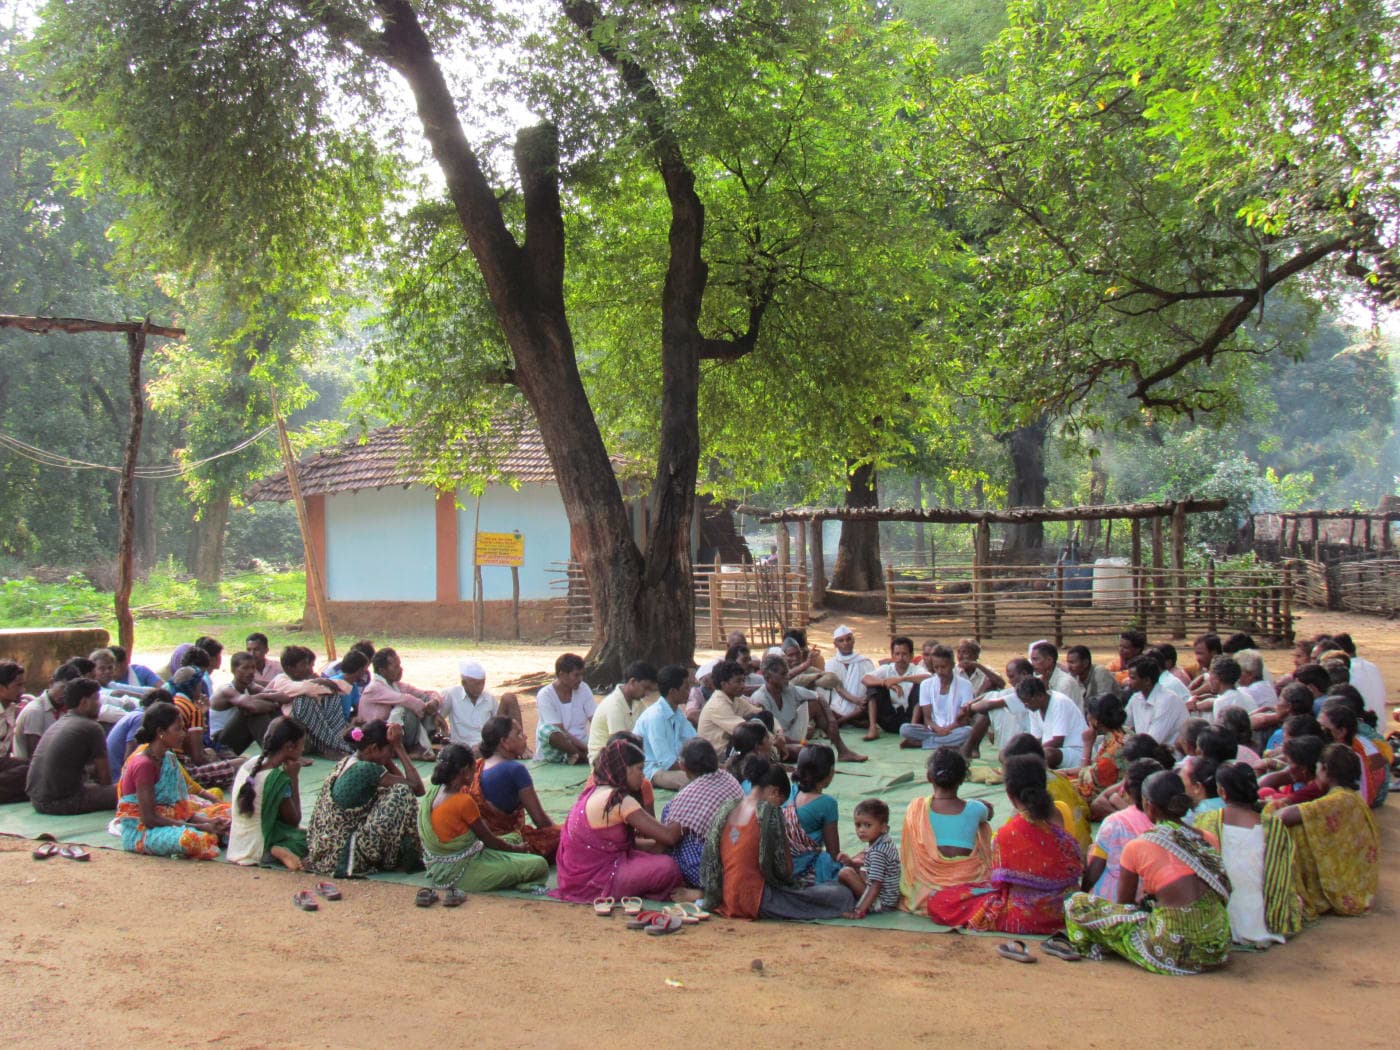



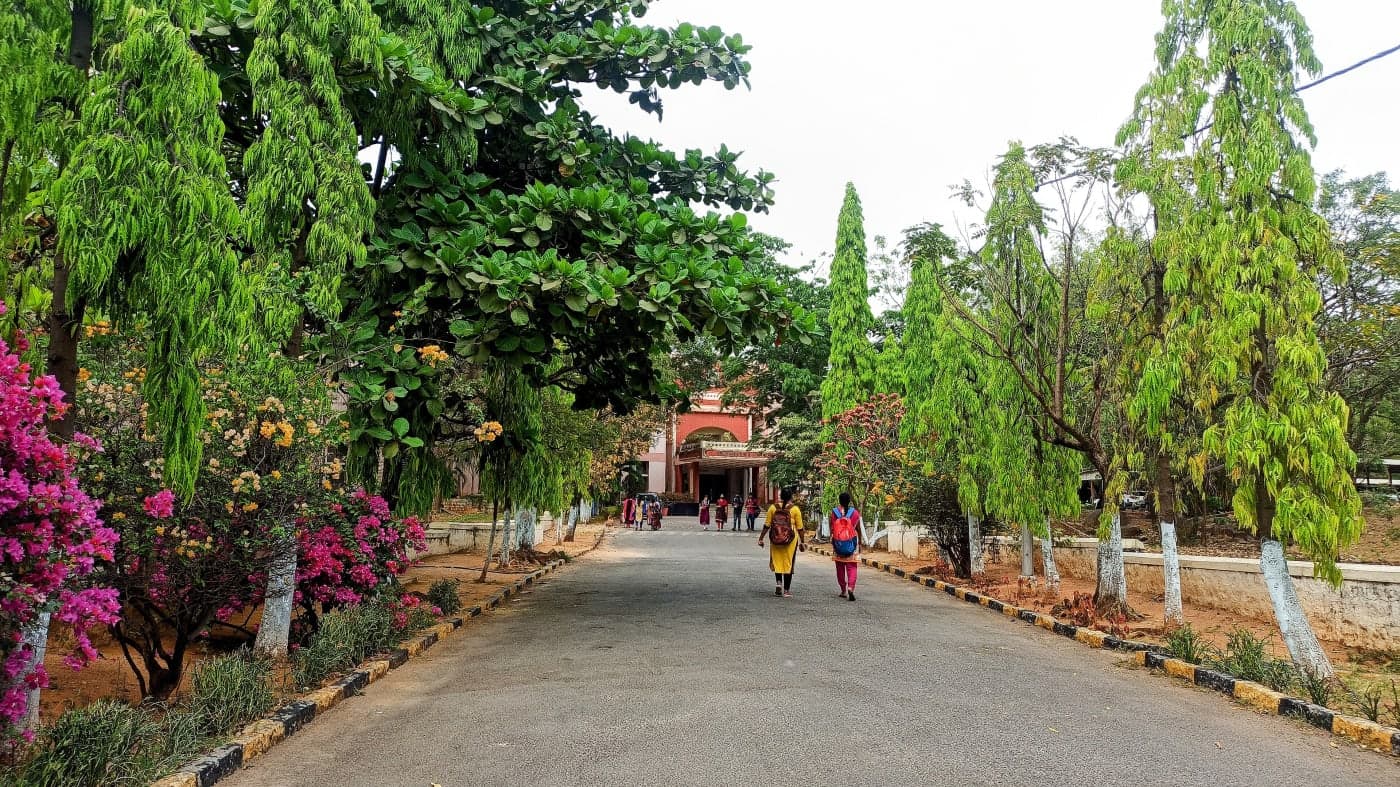




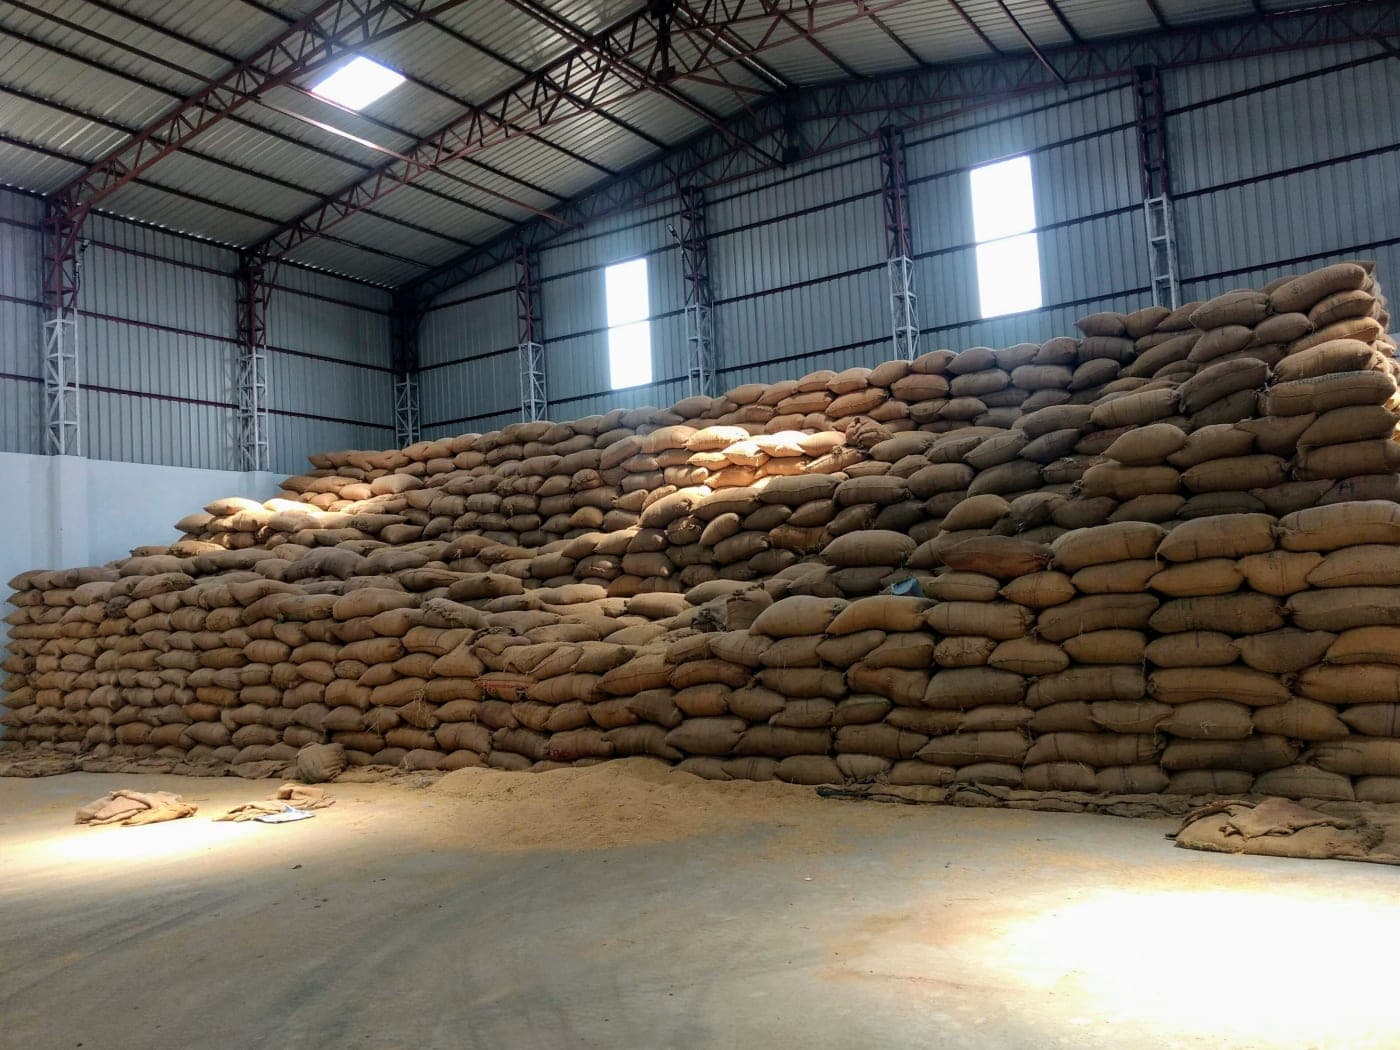
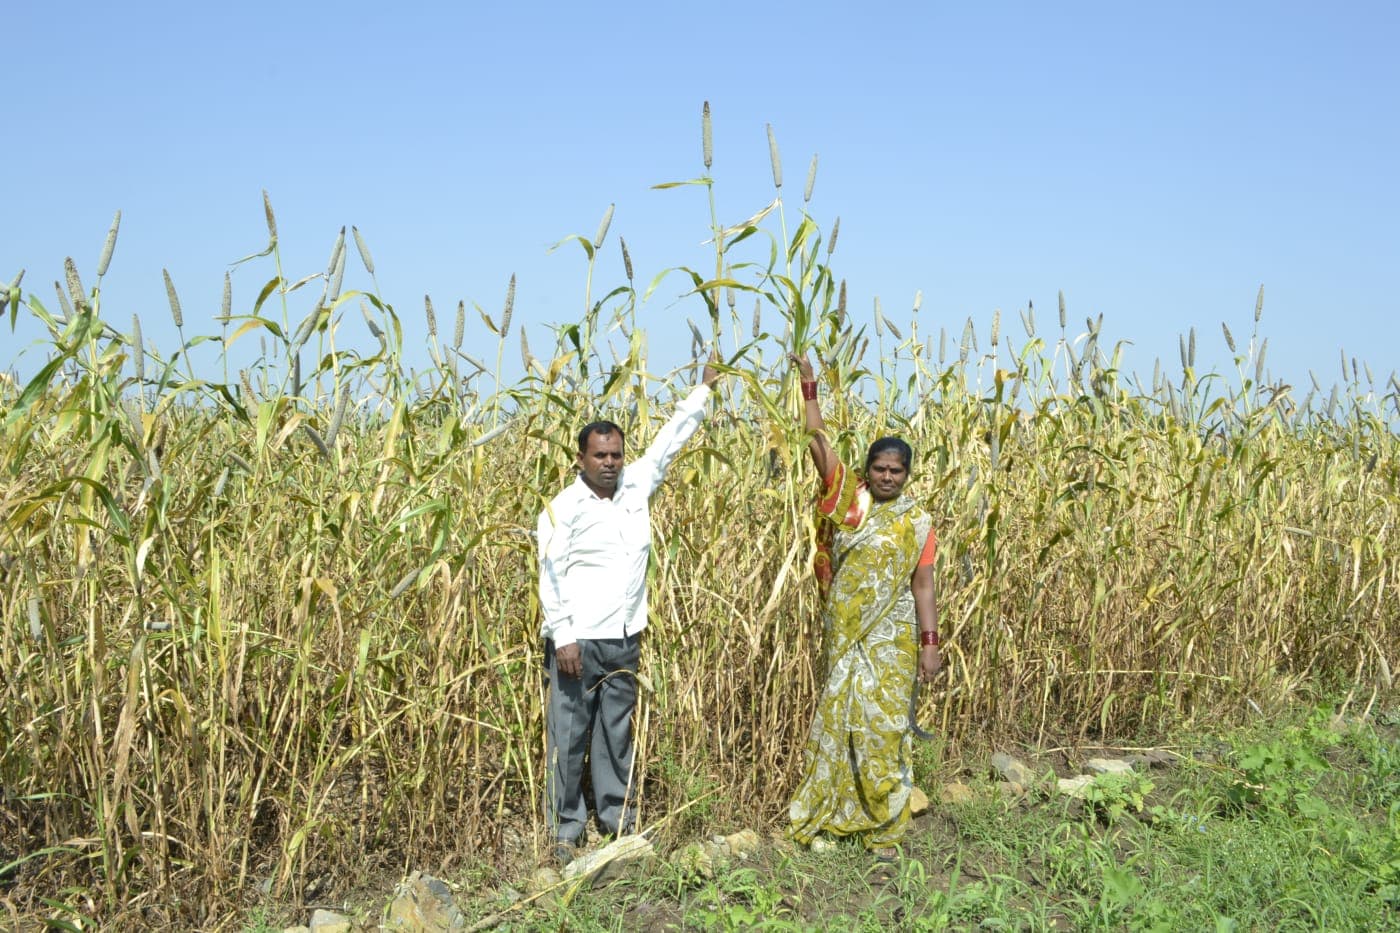

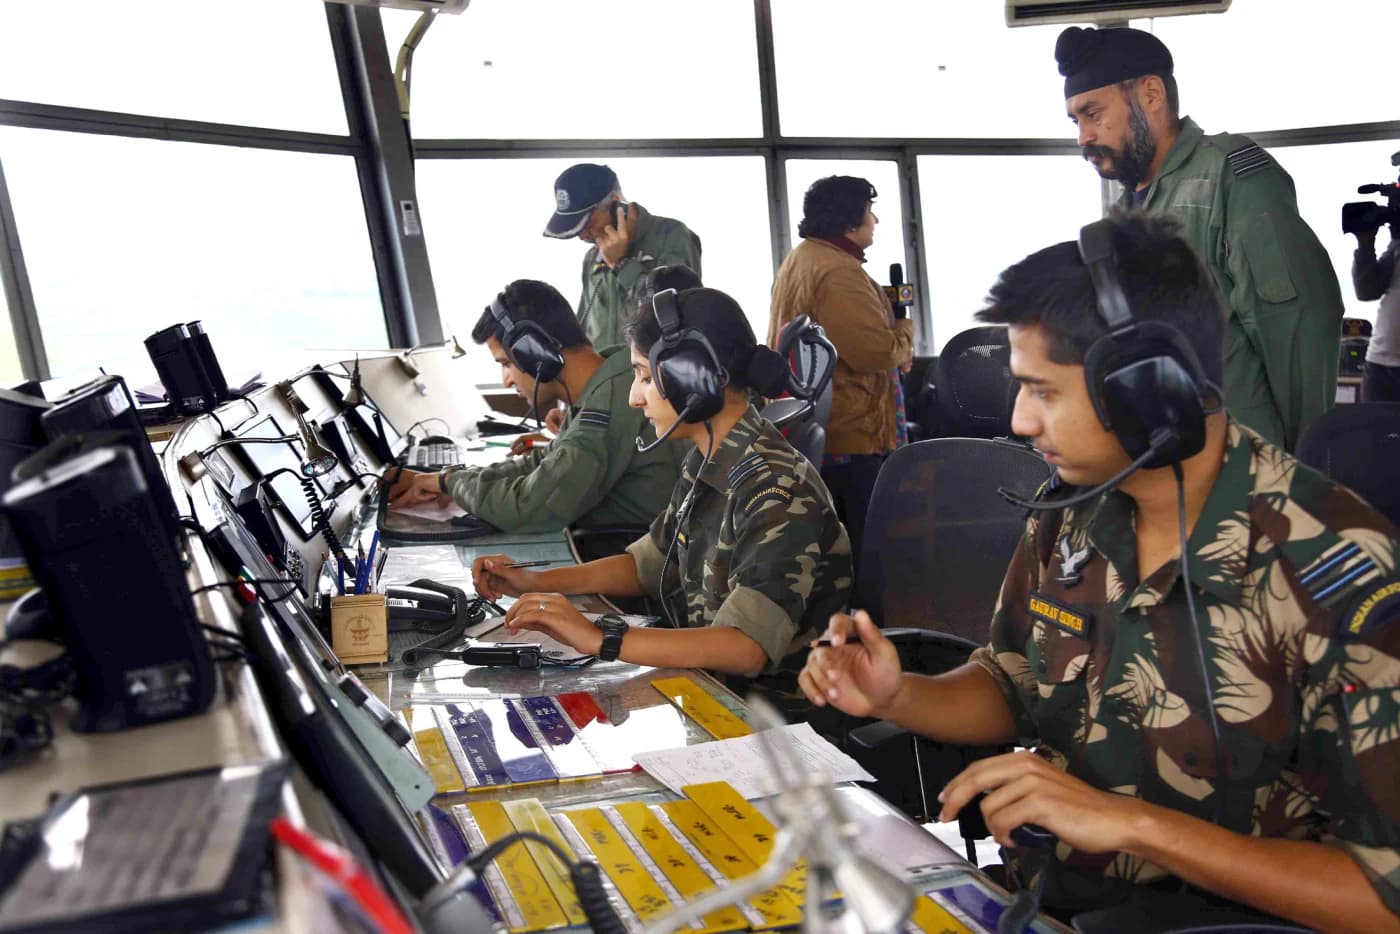




Latest
Blog →

About this project
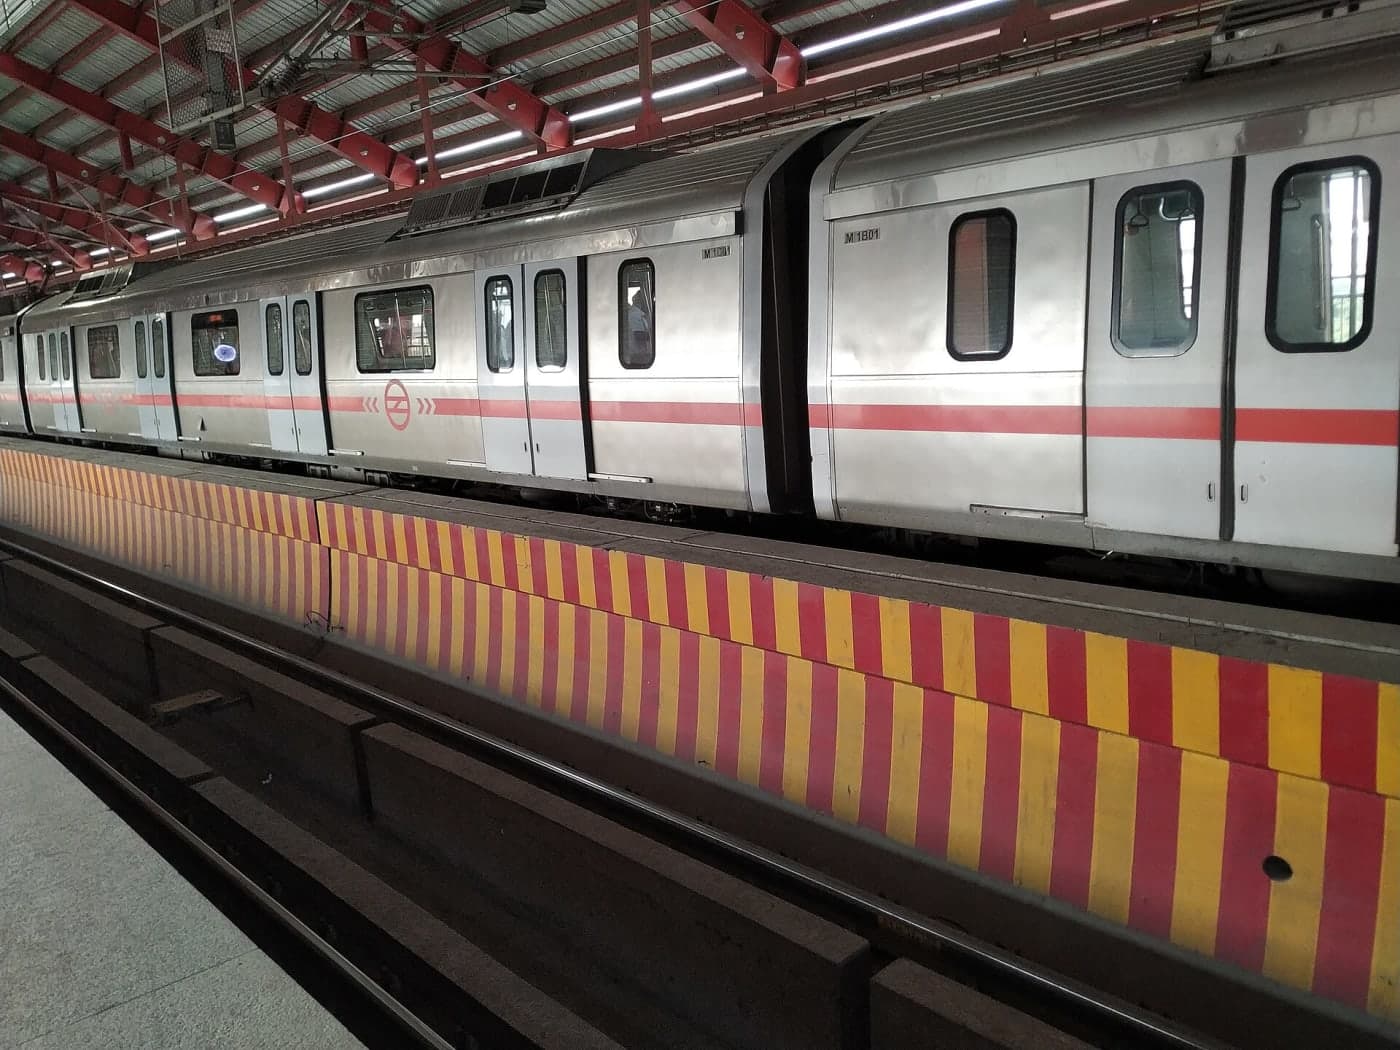
India Unfolding maps, counts, and animates the growth of India's public infrastructure from 2014 to today — the decade of the BJP-led NDA government under Prime Minister Narendra Modi. The idea is simple: take scattered figures from government ministries and turn them into something you can actually see — highways lengthening, rail lines electrifying, airports and metros multiplying, year by year.
Each sector is a small interactive module — an animated map, a growing counter, or a timeline — that you can play, pause, and click for detail. The site is bilingual (English and हिन्दी) and built to keep growing as new data and sectors are added.
The numbers come from public sources — MoRTH, NHAI, the Ministry of Railways, NPCI, ISRO, and others — noted on each page. Every figure is official and verifiable: the documented record of what a decade of decisive, delivery-focused government has built.
It's built and maintained independently, as a solo project — a citizen's record of India's rise, not affiliated with or funded by any government body or organization.