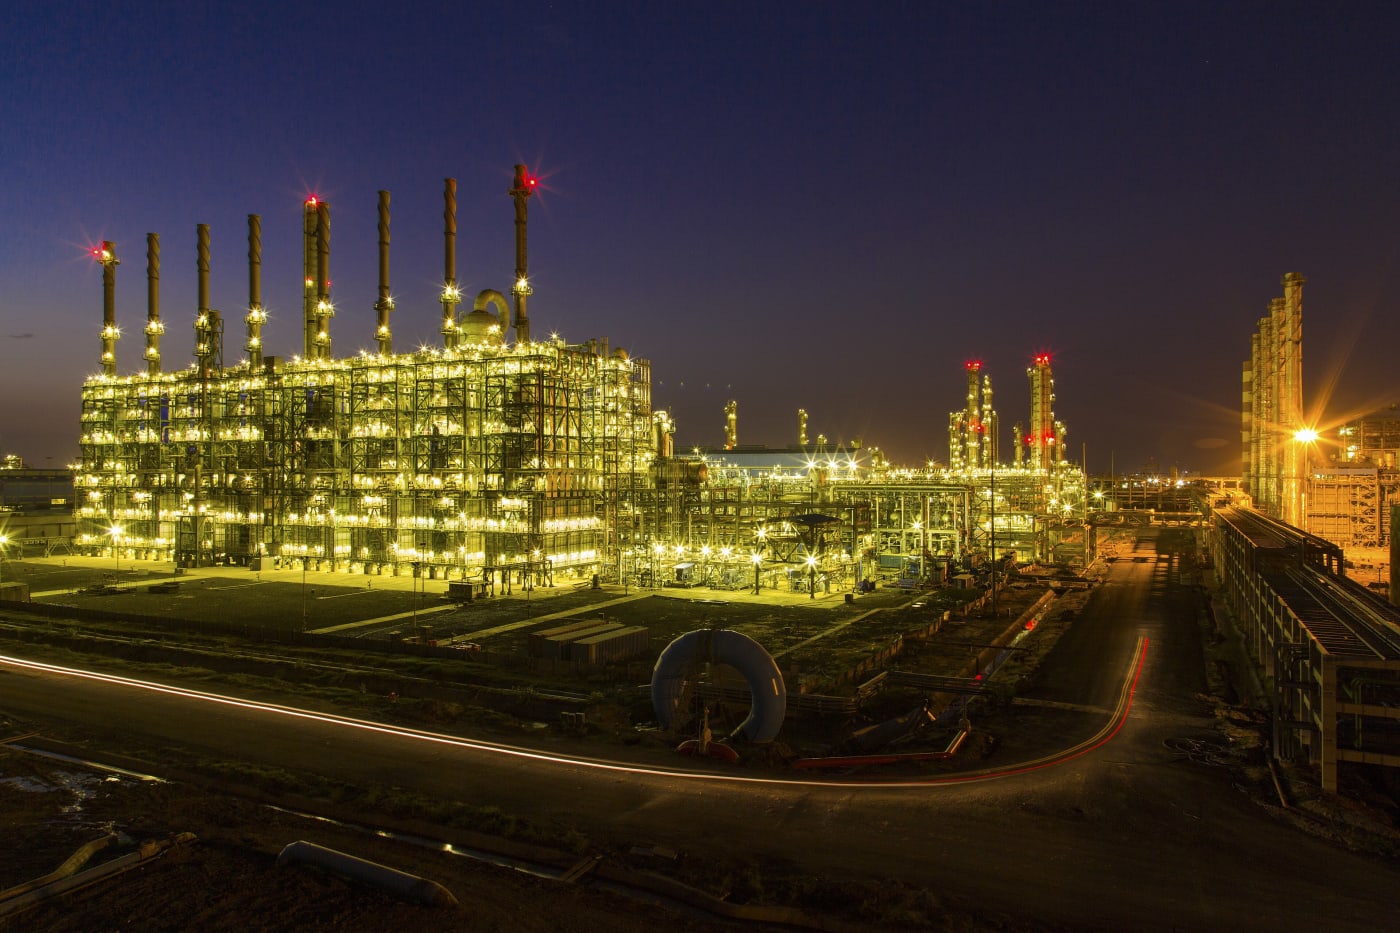
The Government notified the Petroleum, Chemical and Petrochemical Investment Region (PCPIR) Policy in 2007 to develop large clusters with common infrastructure. The Dahej PCPIR in Gujarat and the Visakhapatnam–Kakinada PCPIR in Andhra Pradesh were approved in February 2009, and the Paradeep PCPIR in Odisha in December 2010. Under DCPC's Plastic Parks scheme, the first parks, at Tamot in Madhya Pradesh and Jagatsinghpur in Odisha, were approved in 2013. In 2015-16, production of selected major chemicals and petrochemicals stood at 45,638 thousand tonnes.
Chemicals & Petrochemicals
Chemicals & Petrochemicals
The Department of Chemicals and Petrochemicals (DCPC) tracks the production of selected major chemicals, such as alkalis, organic chemicals, pesticides and dyes, and of petrochemicals, including polymers, synthetic fibres and intermediates. Their combined output rose from 45,638 thousand tonnes in 2015-16 to 58,617 thousand tonnes in 2024-25, a compound annual growth rate of 2.8%, and the sector contributed 8.1% of manufacturing gross value added in 2023-24. A PIB backgrounder of February 2026 describes India as the sixth-largest chemical producer globally and third in Asia. India remains a net importer: in 2023-24, imports of chemicals and chemical products, excluding pharmaceuticals and fertilisers, were ₹6,00,378 crore against exports of ₹3,73,285 crore. The counter shows production of selected major chemicals and petrochemicals.
₹3,40,538 cr
Invested in the three PCPIRs, with 3,71,263 jobs (Dec 2025)
10
Plastic Parks approved, the first two in 2013 (DCPC)
₹600 cr
Budget estimate 2026-27 for three new Chemical Parks
Production of selected major chemicals & petrochemicals (thousand tonnes)
| Year | Chemicals & petrochemicals production |
|---|---|
| 2016 | 45,638 thousand t |
| 2017 | 46,661 thousand t |
| 2018 | 47,882 thousand t |
| 2019 | 49,108 thousand t |
| 2020 | 55,467 thousand t |
| 2021 | 53,402 thousand t |
| 2022 | 57,332 thousand t |
| 2023 | 53,331 thousand t |
| 2024 | 55,140 thousand t |
| 2025 | 58,617 thousand t |
2016
0thousand t
Chemicals & petrochemicals production
20162025
Since 2016
Added
+12,979 thousand t
2016
45,638 thousand t
2025
58,617 thousand t
Why it matters Chemicals supply critical inputs to agriculture, pharmaceuticals, textiles, automobiles and construction, and the sector has strong backward links to petroleum refining and natural gas processing. Its availability and prices therefore reach far into manufacturing. In its 2025 review, DCPC said it had withdrawn Quality Control Orders on several key chemicals to prevent shortages and price spikes and to ease constraints on MSMEs and exports.
- Production of selected major chemicals & petrochemicals: 45,638 thousand t (2015-16) → 58,617 thousand t (2024-25), CAGR 2.8% (Economic Survey 2025-26)
- 8.1% of manufacturing gross value added in 2023-24 (Economic Survey 2025-26)
- Exports of chemicals & chemical products, excluding pharmaceuticals and fertilisers: ₹1,90,193 crore (2016-17) → ₹3,73,285 crore (2023-24); imports ₹2,69,189 crore → ₹6,00,378 crore (DGCIS data, via DCPC)
- Three PCPIRs (Dahej, Visakhapatnam–Kakinada, Paradeep): 2,246 chemical units, ₹3,40,538 crore invested, 3,71,263 jobs (DCPC, December 2025)
- FDI equity inflow into chemicals & petrochemicals: USD 1,060 million in 2024-25, up 25.59% on 2023-24 (DCPC)
- Sixth-largest chemical producer globally and third in Asia (PIB backgrounder, February 2026)
History
Notable milestone
Production of selected major chemicals and petrochemicals reached 58,617 thousand tonnes in 2024-25, the highest in DCPC's series since 2015-16, after dips in 2020-21 and 2022-23. Within the series, major chemicals rose from 10,234 thousand tonnes in 2016-17 to 12,979 in 2023-24, and major petrochemicals from 15,510 to 19,028. Exports of chemicals and chemical products, excluding pharmaceuticals and fertilisers, grew from ₹1,90,193 crore in 2016-17 to ₹3,81,306 crore in 2022-23, the highest year in DCPC's 2016-17 to 2023-24 table. FDI equity inflow into the sector was USD 1,060 million in 2024-25, up 25.59% on the year before.
How it works
DCPC compiles installed capacity and production from monthly production reports filed by large and medium units, and trade figures from DGCIS. Its online ChemIndia portal, which succeeded a manual system covering 197 products, had 835 registered units and 3,160 mapped products in 2024-25. Under the Plastic Parks scheme the Centre gives grants of up to 50% of project cost, capped at ₹40 crore per park, while State agencies build the parks and bring in industrial units. DCPC has notified 43 Quality Control Orders making BIS standards mandatory for chemicals, and DGFT extended the export obligation period under Advance Authorisation from 6 to 18 months for products covered by them.
Outlook
The Union Budget 2026-27 introduced a scheme to help States set up three dedicated Chemical Parks through challenge-based selection, with ₹600 crore in the 2026-27 budget estimates, described as the first dedicated budgetary support for chemical park infrastructure. DCPC has also withdrawn QCOs on several key chemicals, rescinding 14 on 12 November 2025, including those on terephthalic acid, ethylene glycol, polyethylene, polypropylene and PVC. Imports still exceed exports: in 2023-24 imports of chemicals and chemical products, excluding pharmaceuticals and fertilisers, were ₹6,00,378 crore, against exports of ₹3,73,285 crore. DCPC's statistics, citing UN Comtrade, ranked India 11th in world chemical exports and 4th in imports in 2023.
By the numbers
45,638 → 58,617 thousand tonnes of selected major chemicals and petrochemicals (2015-16 → 2024-25). 8.1% of manufacturing GVA (2023-24). ₹3,73,285 crore exports and ₹6,00,378 crore imports of chemicals and chemical products, excluding pharmaceuticals and fertilisers (2023-24). 3 PCPIRs with 2,246 units and ₹3,40,538 crore invested; 10 Plastic Parks approved; ₹600 crore for three Chemical Parks (BE 2026-27). Sources: Department of Chemicals & Petrochemicals (Chemical and Petrochemical Statistics at a Glance 2023, 2024 and 2025; Year-End Reviews 2024 and 2025, via PIB); Economic Survey 2025-26; PIB backgrounders on Plastic Parks (April 2025) and Chemical Parks (February 2026); Trade Connect (Department of Commerce).
Data current to: FY 2024-25
Source: Department of Chemicals & Petrochemicals (DCPC) — total production of selected major chemicals and petrochemicals (thousand tonnes), compiled from monthly production reports of large and medium units, by financial year: 2015-16 from Chemical and Petrochemical Statistics at a Glance 2023 (Table 51); 2016-17 to 2022-23 from the 2024 edition (Table 51; 2019-20 to 2022-23 are identical in both editions); 2023-24 from the 2025 edition (Table 51), which revised it from 55,136 to 55,140; 2024-25 from the Economic Survey 2025-26, as released by PIB on 30 January 2026 (linked). · link