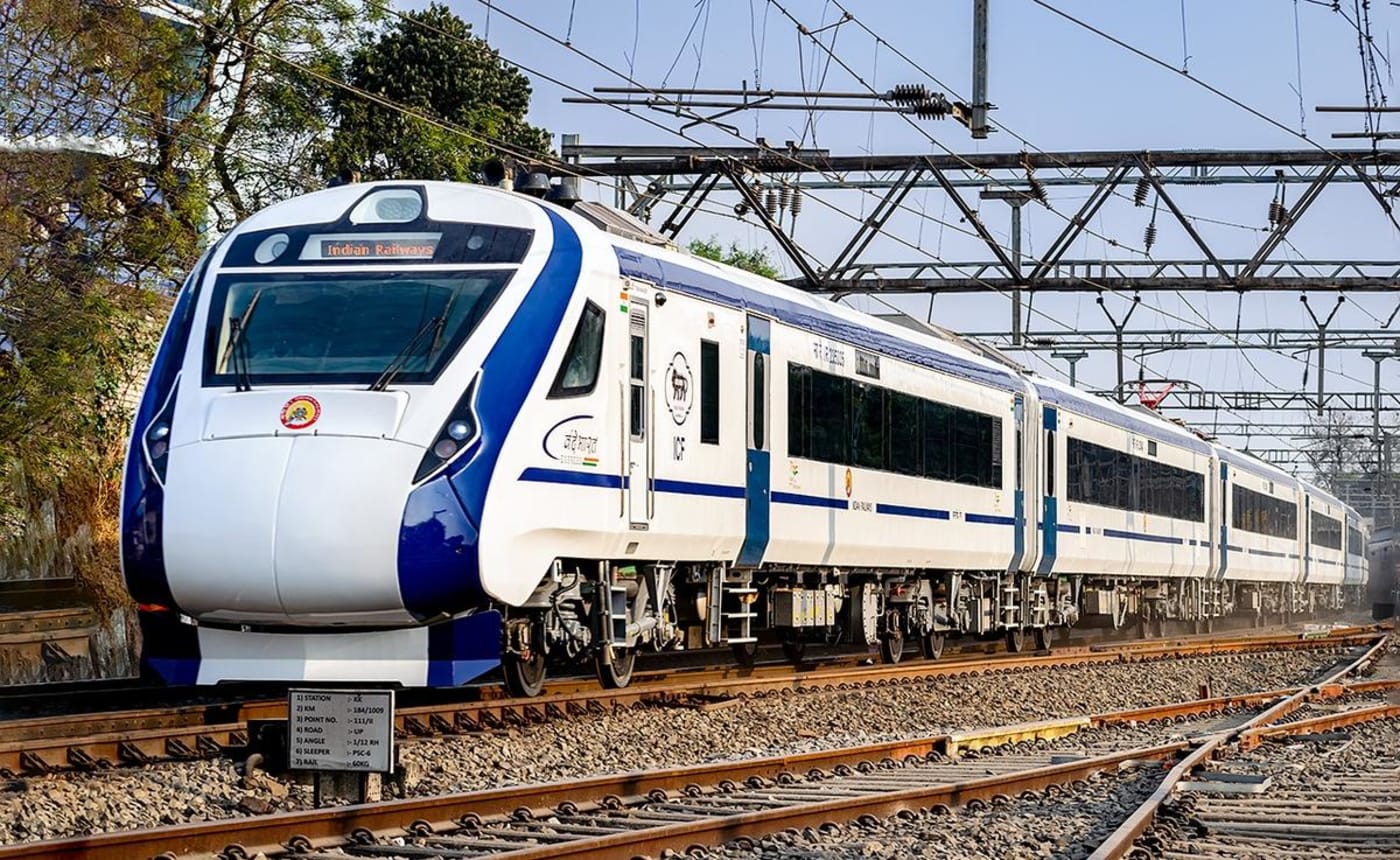
Big claims about a country are easy to make and hard to check. A chart is harder to argue with, as long as every point on it comes from someone accountable for the number.
That is the rule for the ten charts below. Each one is drawn from an official series on India Unfolding: a ministry, a regulator or a government portal, with the date the figure was read. Nothing is estimated between points. Where an official series skips a year, the line simply runs longer between the two points it does have.
Here is what a little over a decade looks like.
1. Digital payments
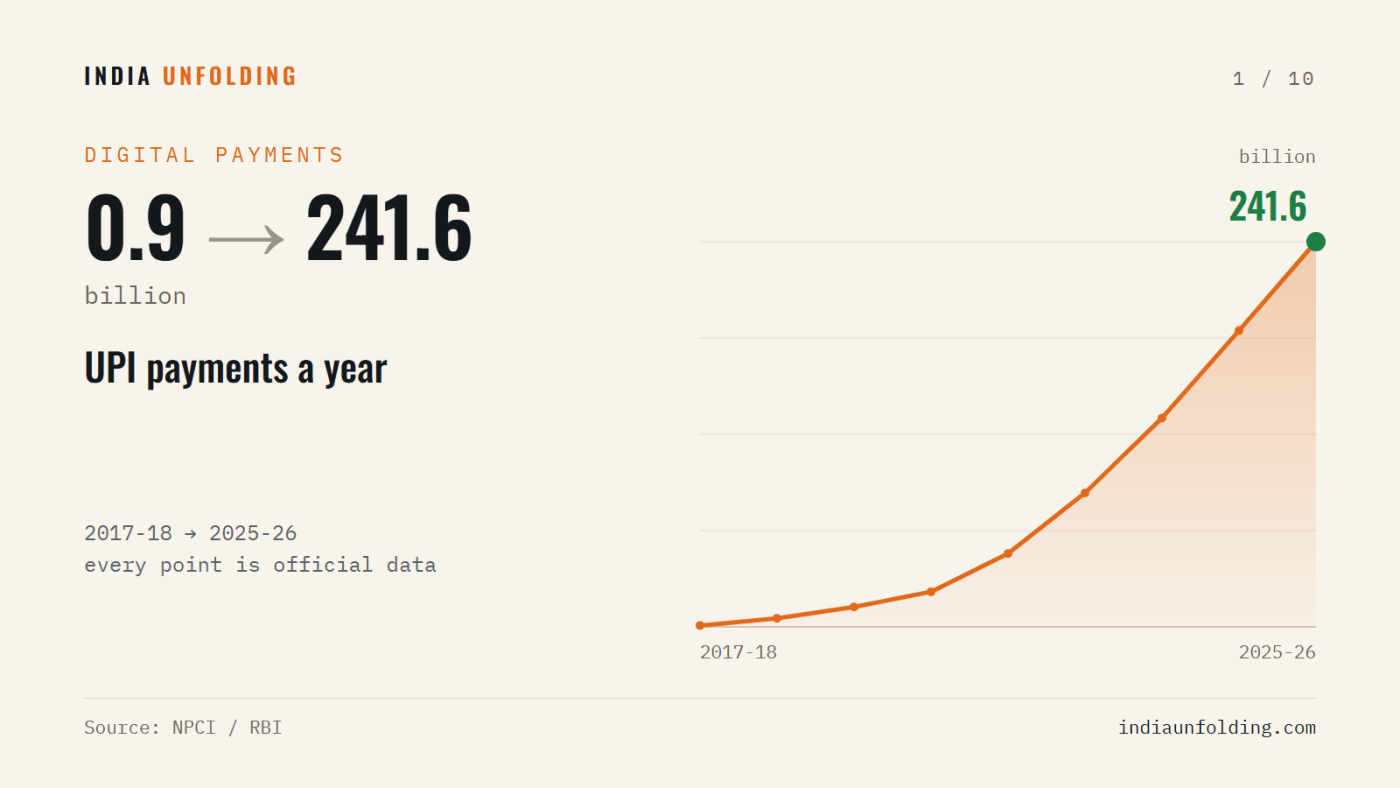
In 2017-18, India made about 0.9 billion UPI payments in the whole year. In 2025-26 it made 241.6 billion. UPI now carries more than 80% of the country's digital payment volume, from street stalls to electricity bills.
UPI and digital public infrastructure →
2. Airports
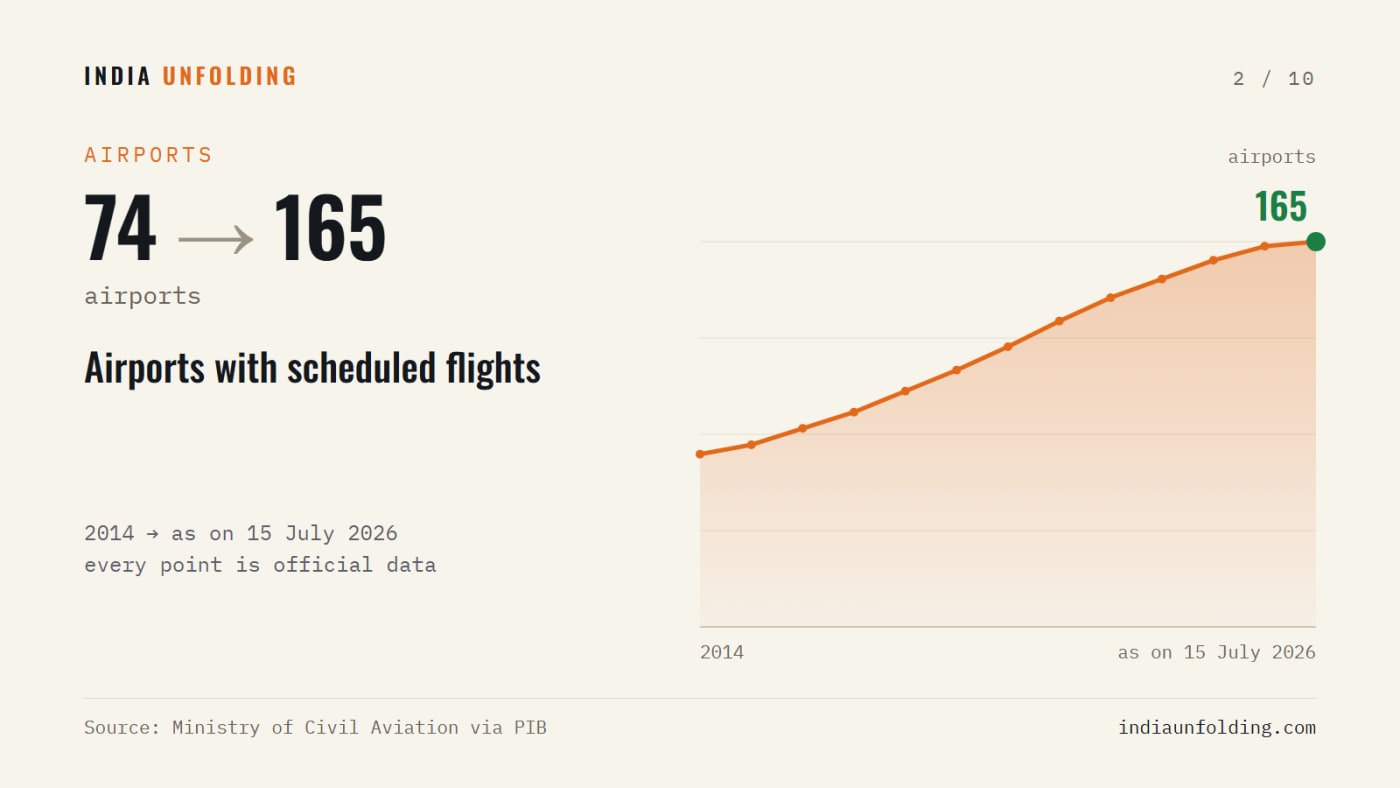
India had 74 airports with scheduled flights in 2014. By 2025 it had 163, and 165 as on 15 July 2026. Much of that growth came through UDAN, the regional connectivity scheme that brought flights to towns that had never had them.
3. Rail electrification
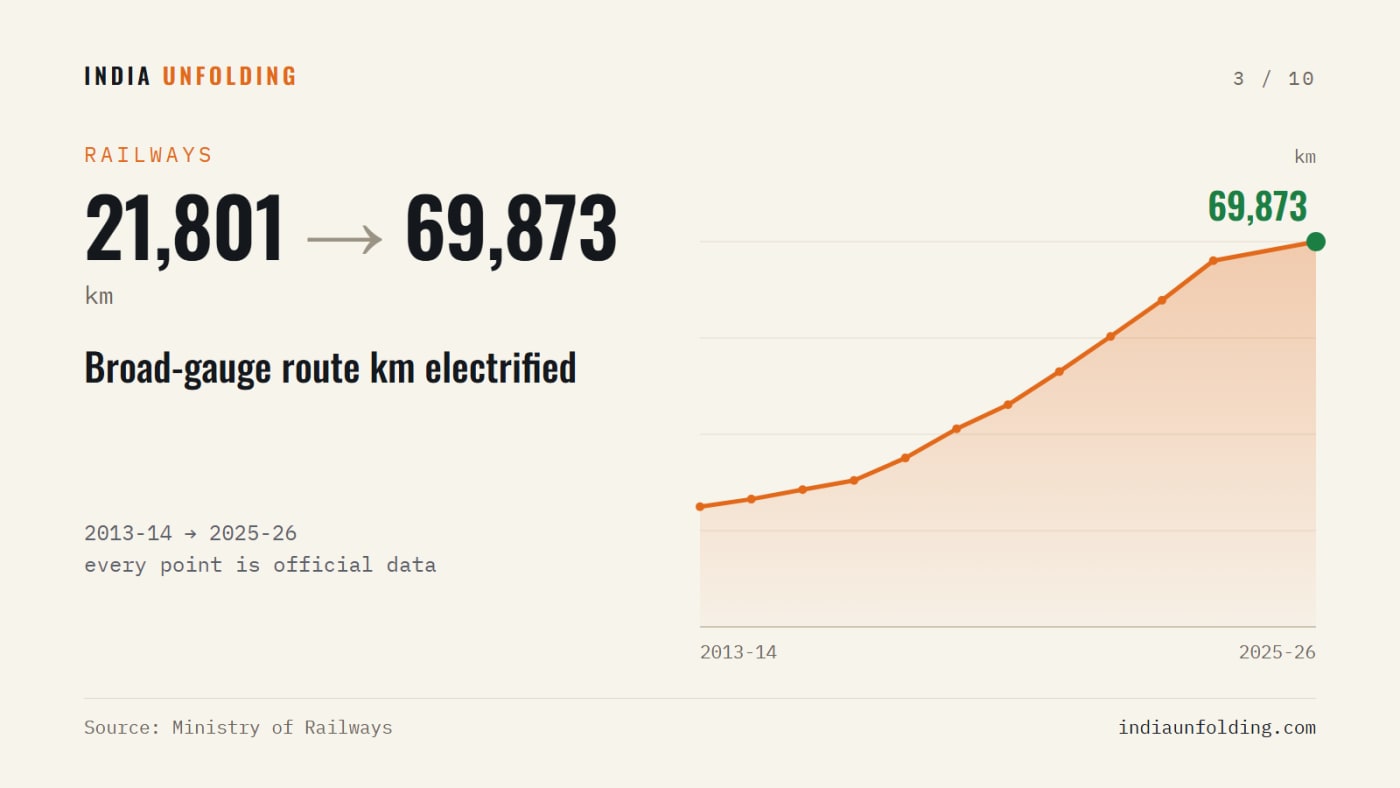
Before 2014, 21,801 route km of broad-gauge track had been electrified. By the end of 2025-26 the figure was 69,873 km, which is 99.6% of the broad-gauge network. Electric trains cut the diesel bill and the emissions that come with it.
4. Clean power
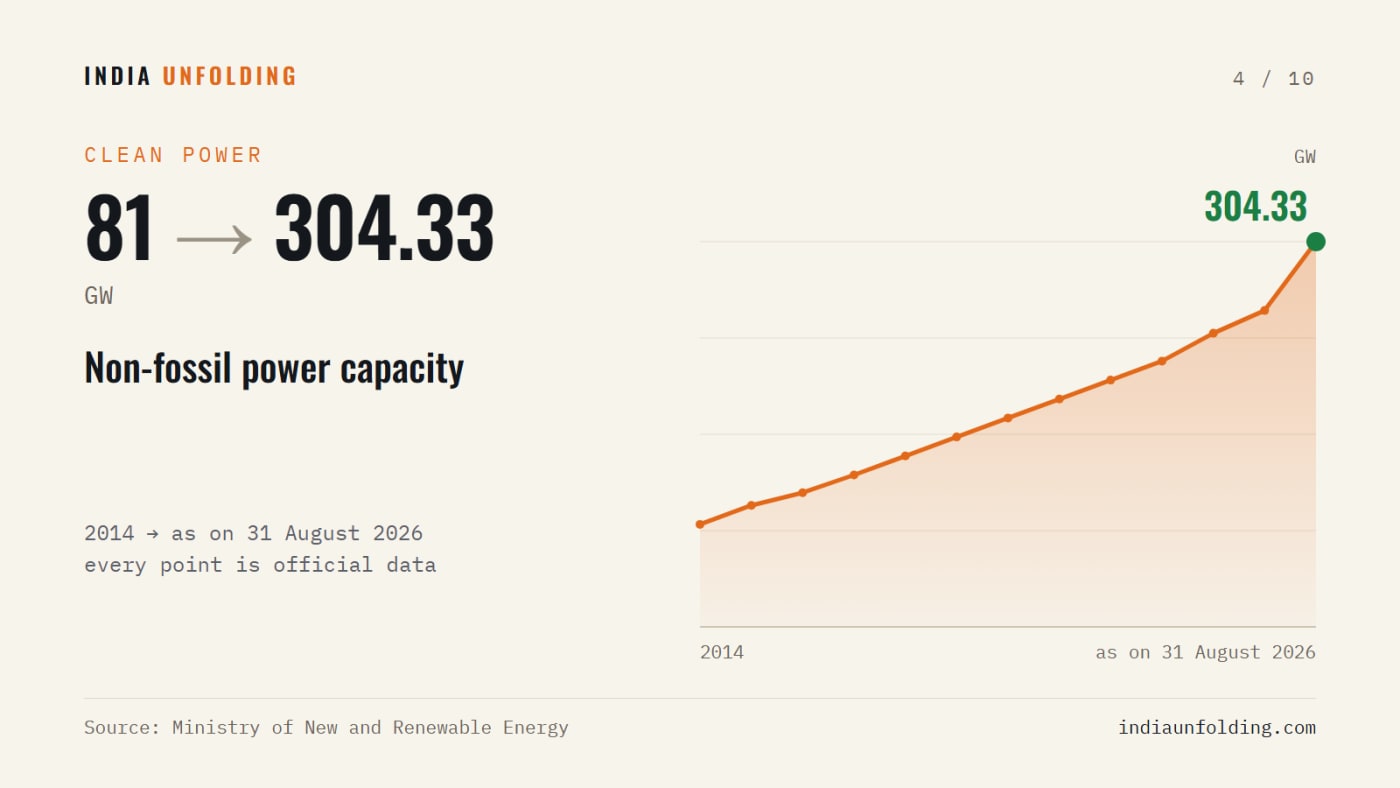
Non-fossil power capacity stood at about 81 GW in 2014. As on 31 August 2026 it was 304.33 GW: 295.55 GW renewable and 8.78 GW nuclear. Solar alone went from 2.82 GW to 168.04 GW.
5. Electronics
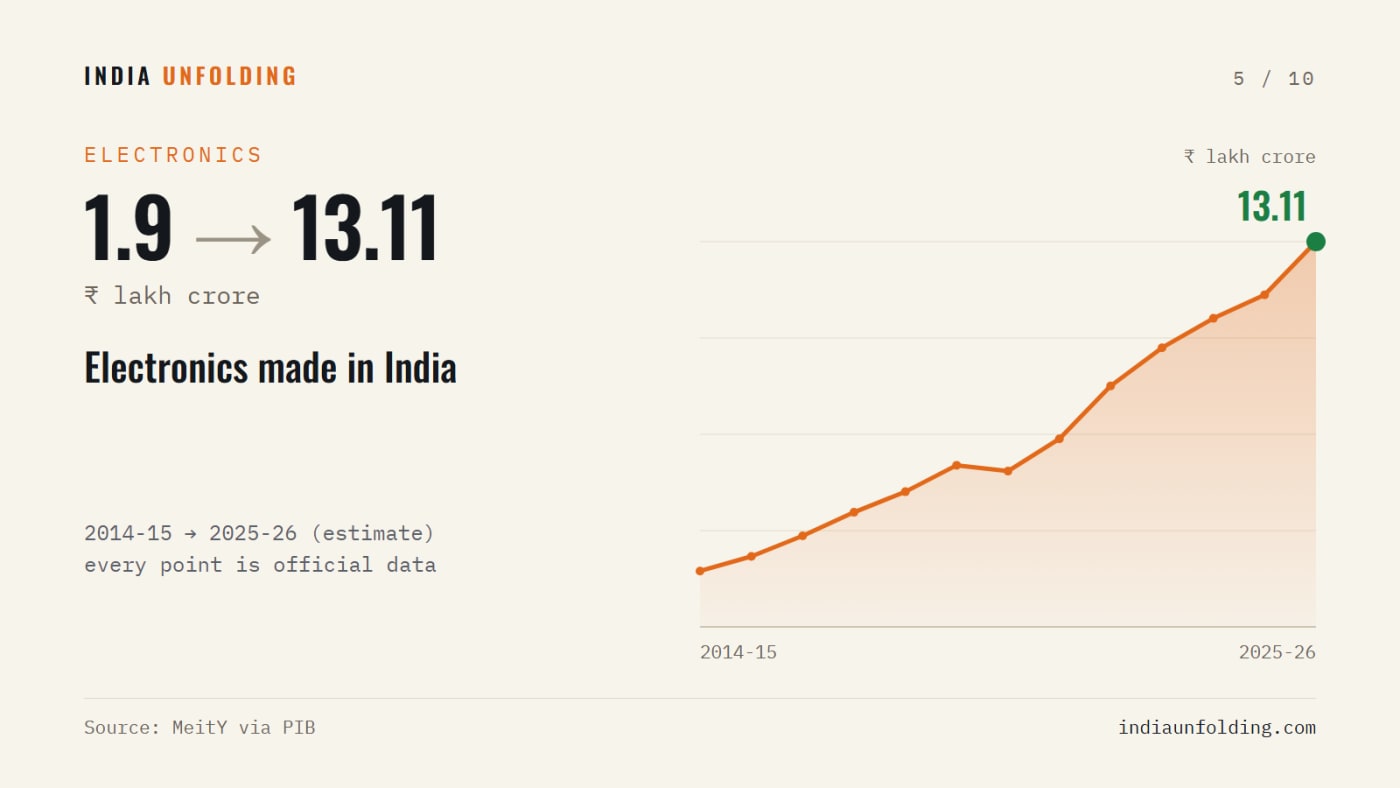
India produced ₹1.9 lakh crore of electronics in 2014-15. The estimate for 2025-26 is ₹13.11 lakh crore, close to seven times as much. Today 99% of the phones sold in India are made in India.
6. Defence exports
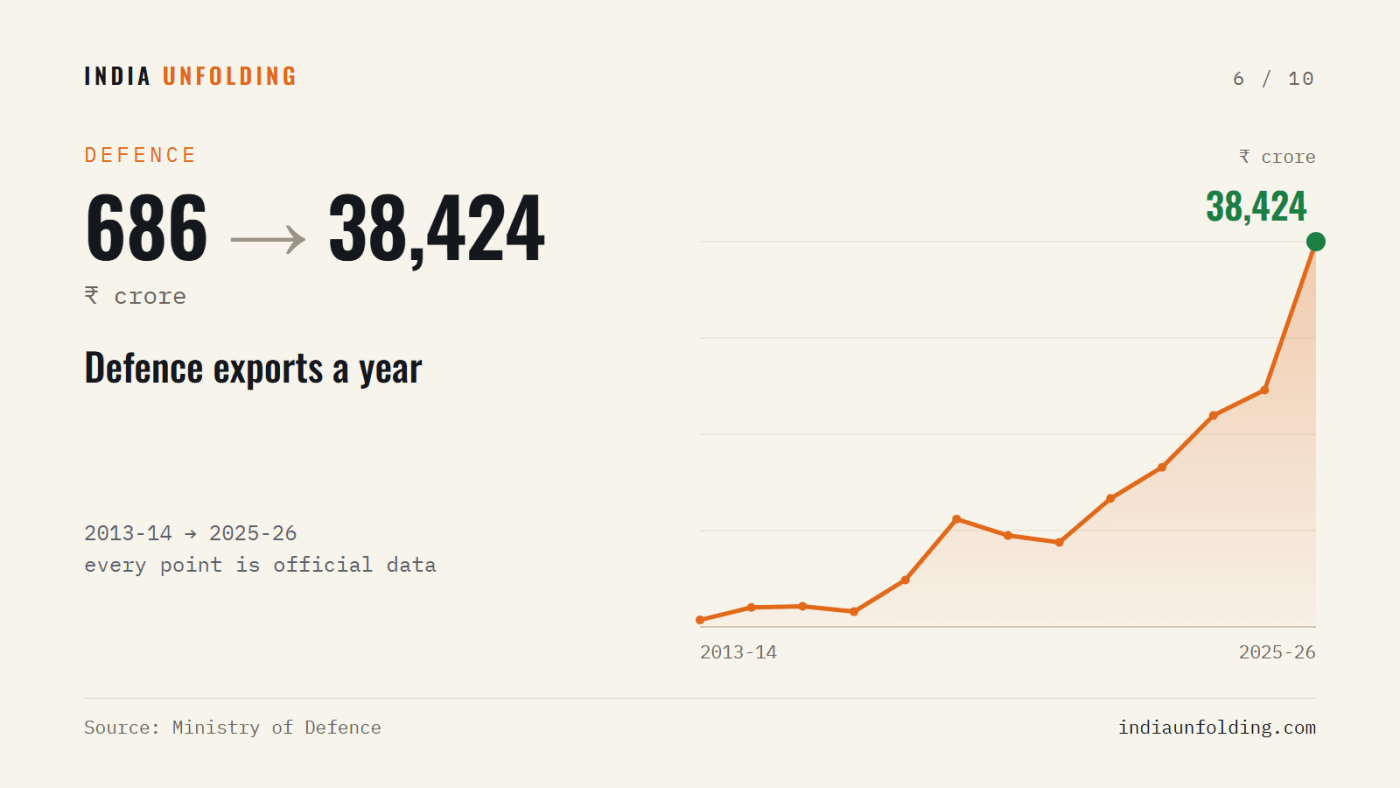
India exported ₹686 crore of defence equipment in 2013-14. In 2025-26 it exported ₹38,424 crore, a record. Domestic defence production also hit a record that year, at ₹1.78 lakh crore.
7. Tap water in rural homes
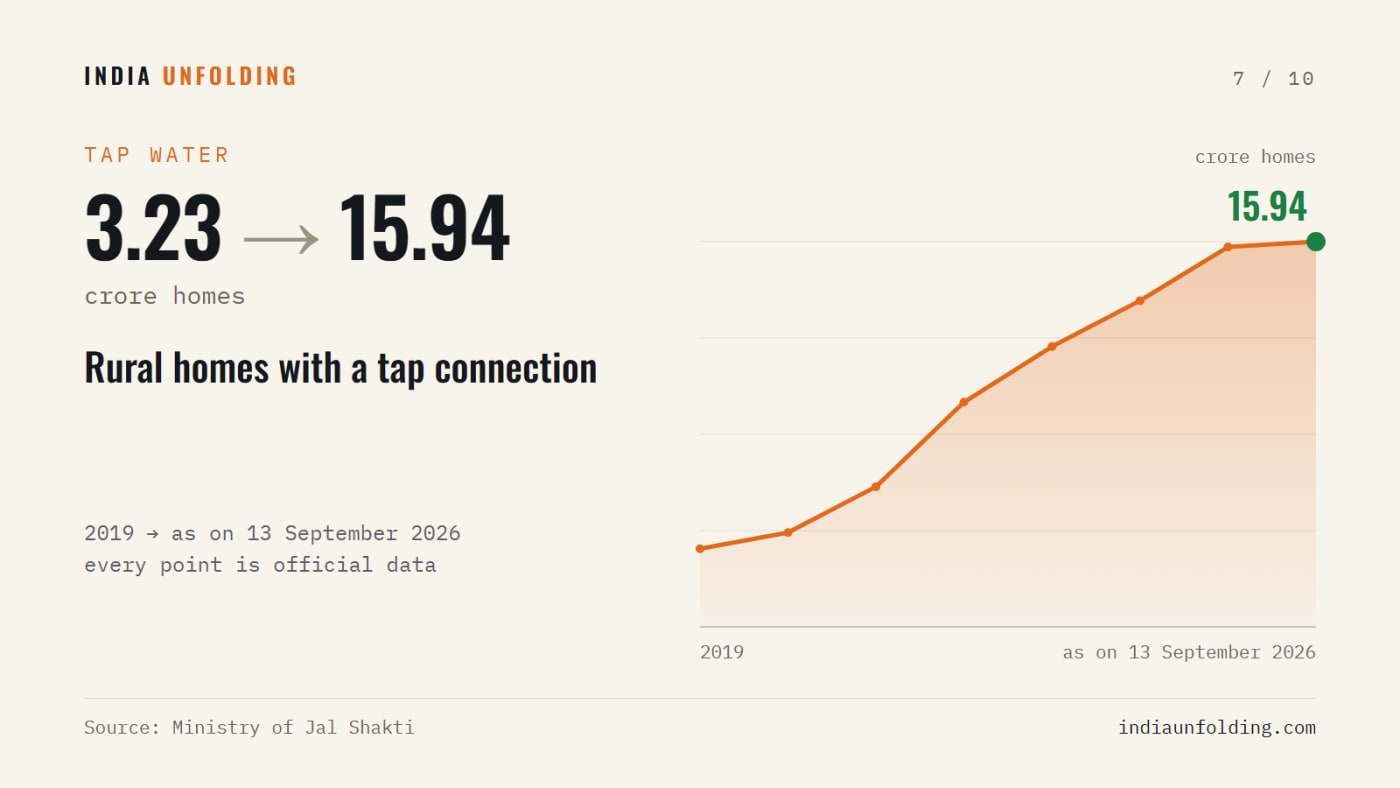
When the Jal Jeevan Mission began in 2019, 3.23 crore rural homes had a tap connection. As on 13 September 2026 the number was 15.94 crore, or 82.38% of rural households: water at home instead of a walk to a well or a village tap.
8. Bank accounts for everyone
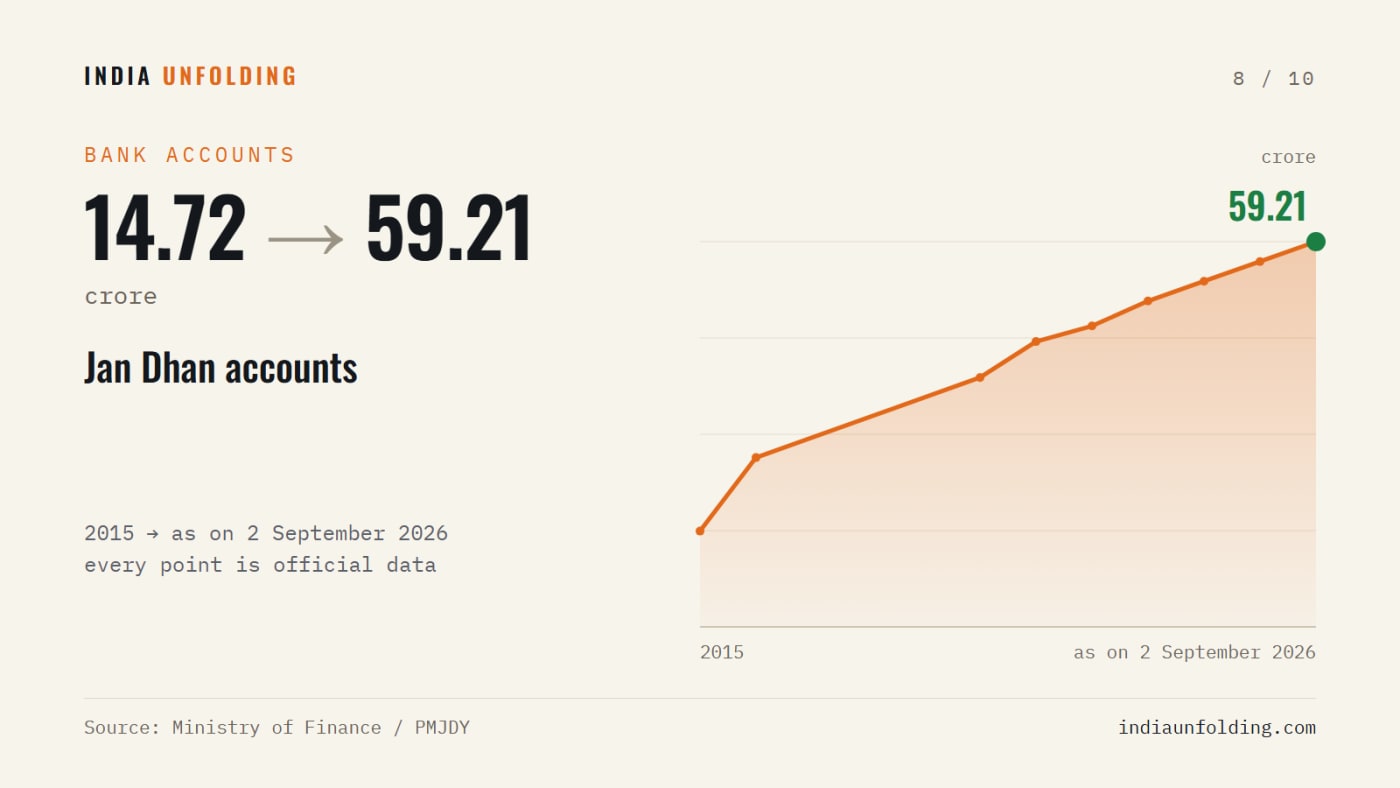
In March 2015 there were 14.72 crore Jan Dhan accounts. On 2 September 2026 there were 59.21 crore, holding ₹3,17,122 crore in deposits. About 56% of the accounts belong to women. There are no official counts for 2017 to 2019, so the chart doesn't plot those years.
9. Money sent straight to people
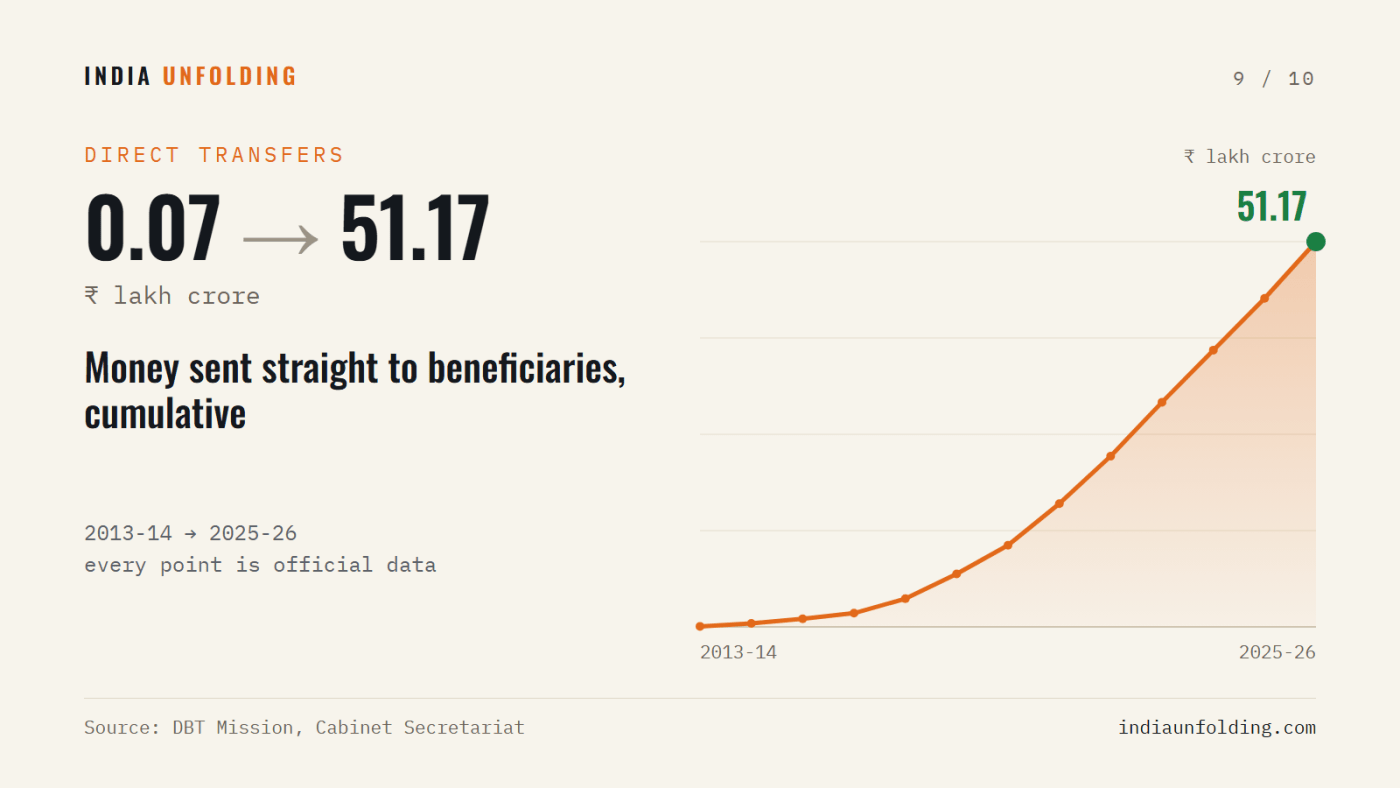
In 2013-14, ₹0.07 lakh crore (about ₹7,000 crore) went straight into beneficiaries' accounts through Direct Benefit Transfer. By the end of 2025-26 the running total was ₹51.17 lakh crore. By September 2026 the DBT Bharat portal showed ₹53.26 lakh crore across 320 schemes, paid to the person it was meant for with no middleman.
10. Documents on a phone
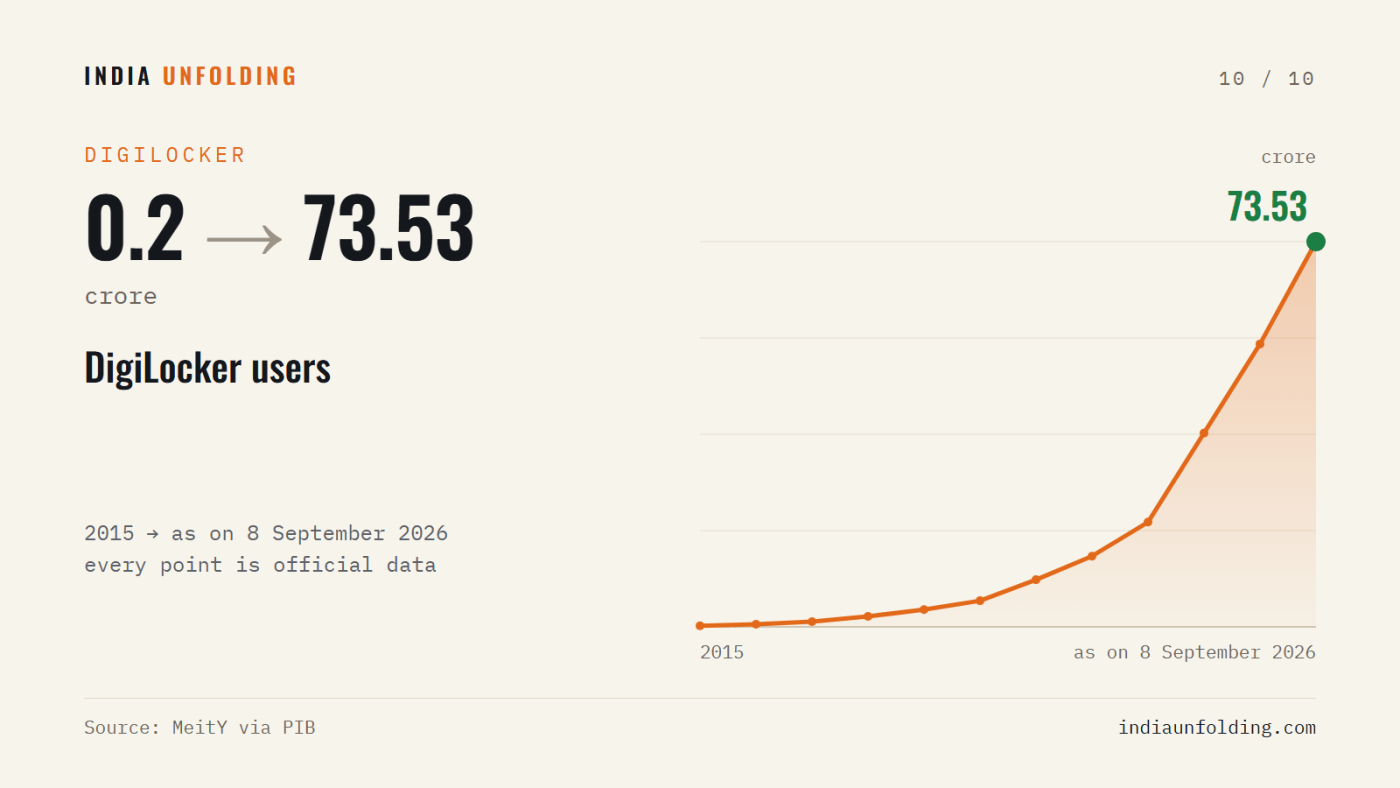
DigiLocker had 0.2 crore users in 2015. In September 2026 it had 73.53 crore, and about 950 crore documents have been issued through it. A driving licence or a mark sheet in DigiLocker is legally valid, with no photocopy needed.
How these charts were made
Each chart uses the same series as its page on India Unfolding. The years follow each source's own basis. Financial-year series (UPI, rail, electronics, defence, DBT) are labelled 2017-18 and so on. Running totals end on the date the figure was read. Each page lists its source, with a link where one is available.
These ten are a small part of the record. The site follows 200 sectors in English and Hindi, and you can check every figure against its source.