India Unfolding
2014 → 2026

India, built in the open.

A nation, unfolding in data.

India's growth since 2014 — infrastructure, economy, health, defence, digital and more — sourced, mapped, and yours to judge.

Explore all 113 sectors113 sectors · 25 milestones · EN / हिन्दी

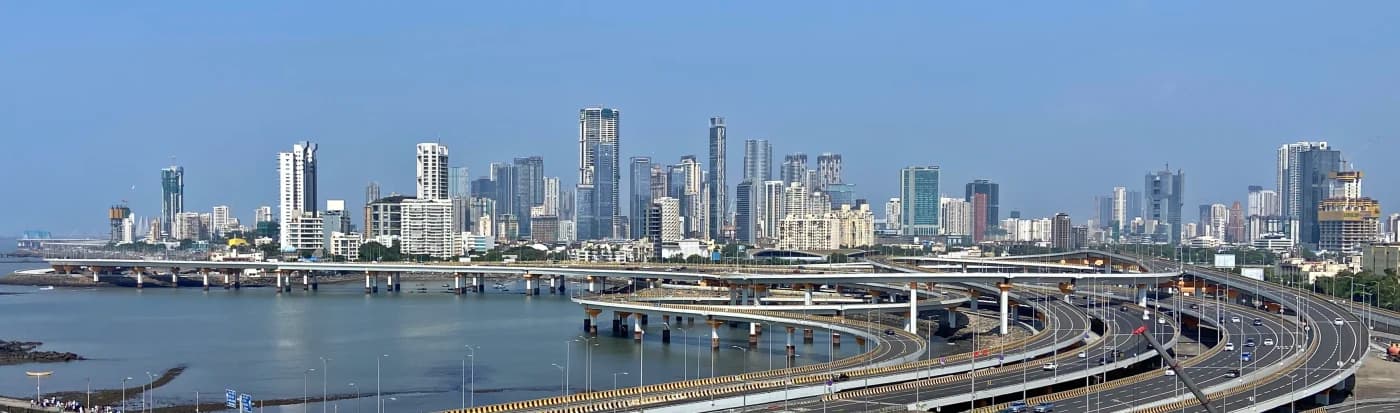
Since 2014, India has been building at a scale and speed the world is watching — not just roads, railways and airports, but power grids and digital payments, factories and hospitals, defence and space, welfare and a fast-rising economy. The story of a fifth of humanity, remade year after year.

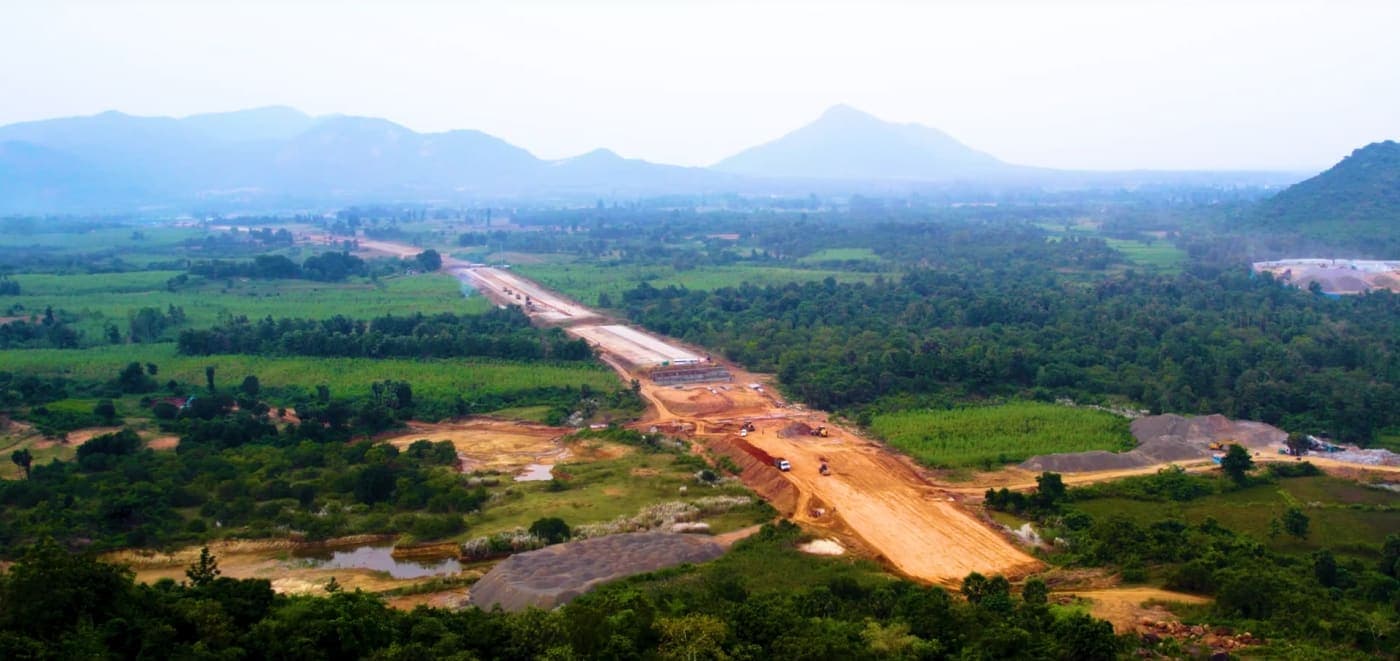
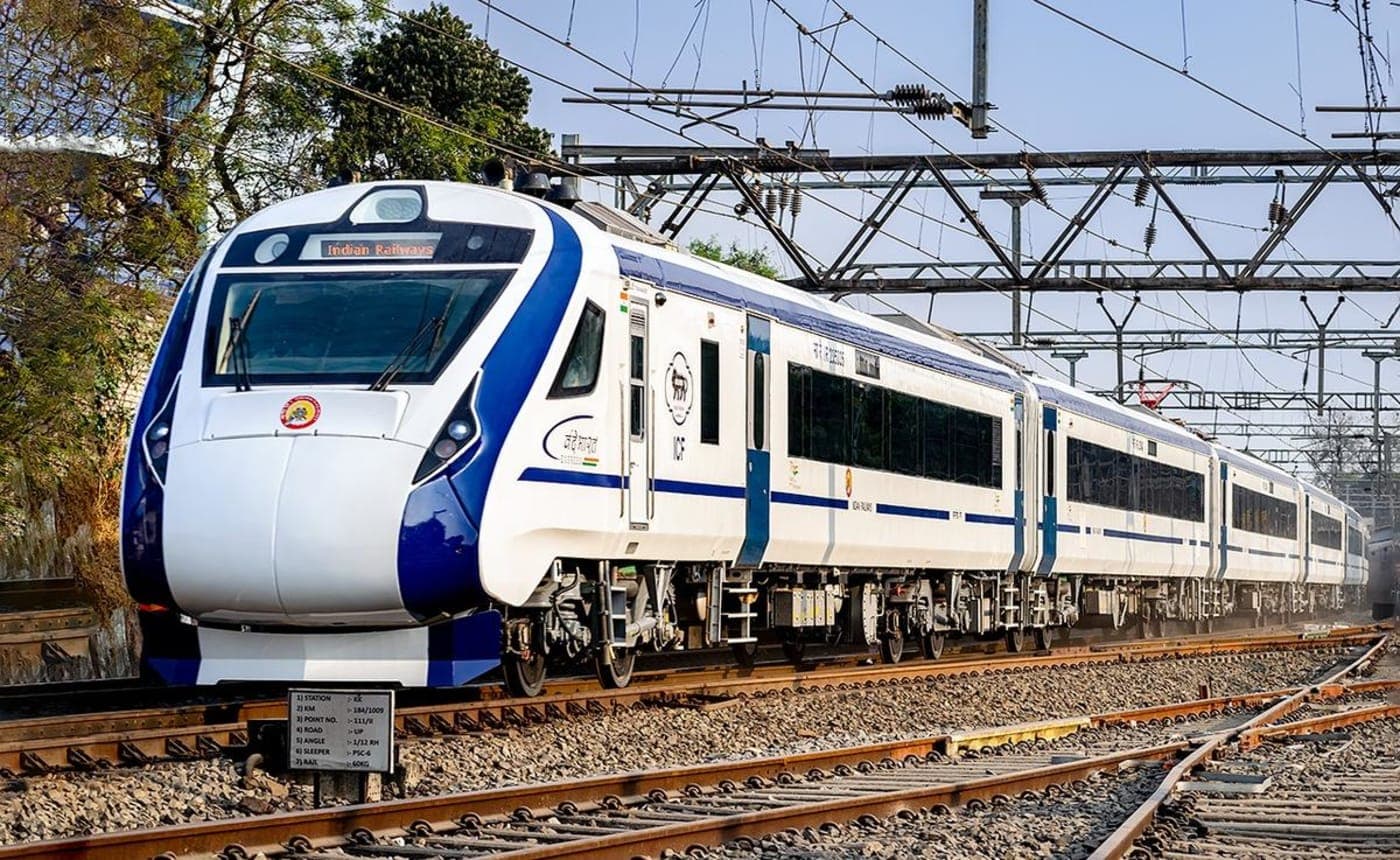
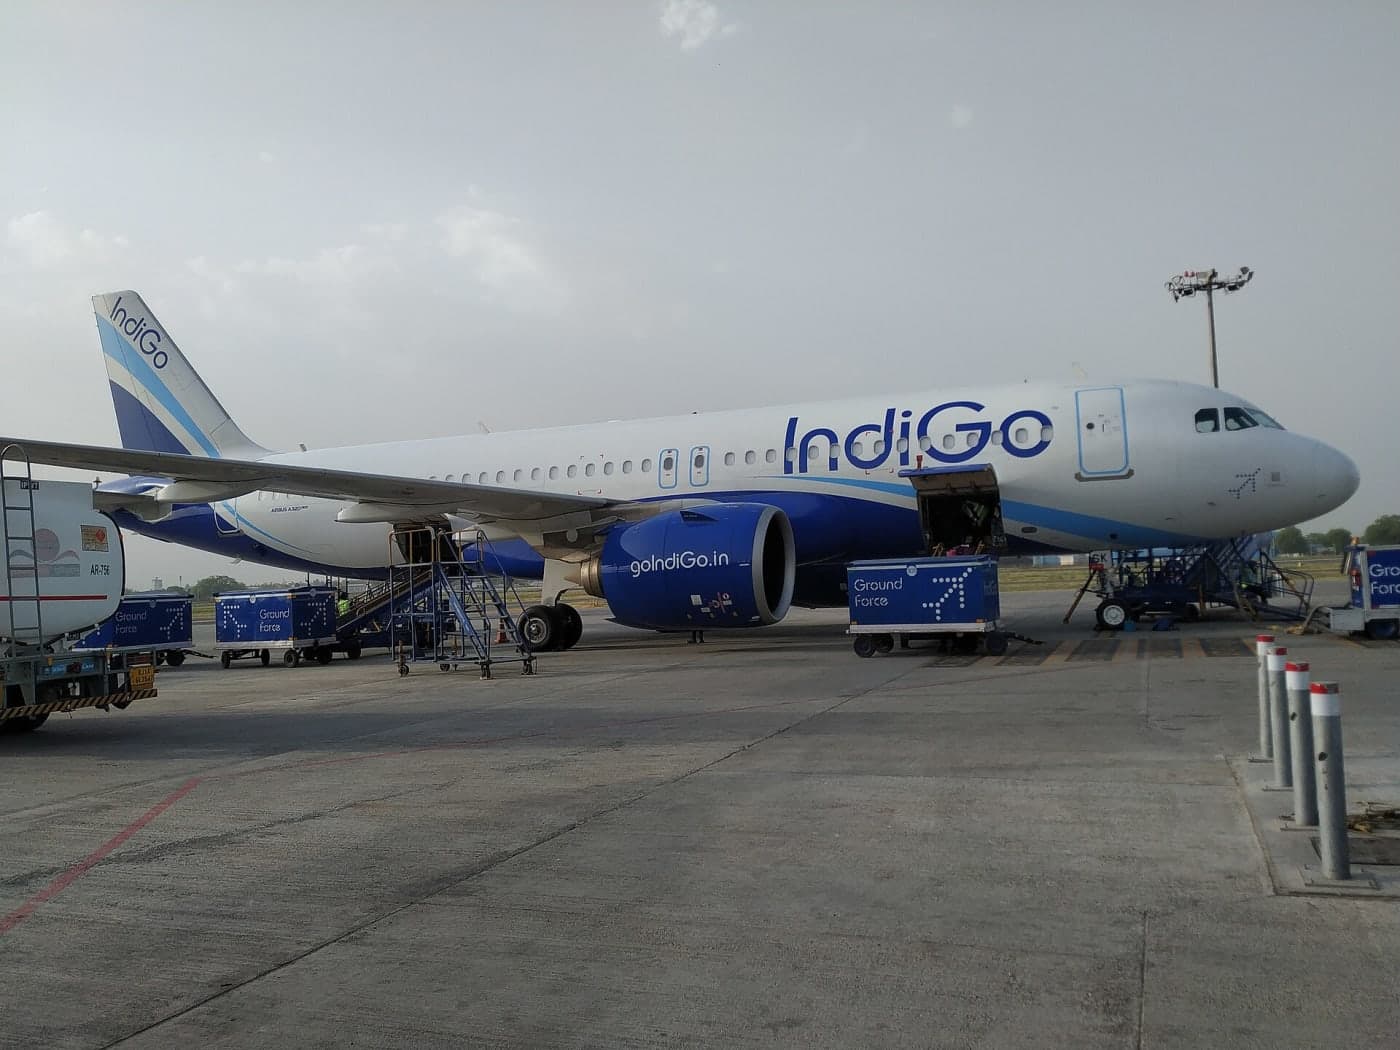
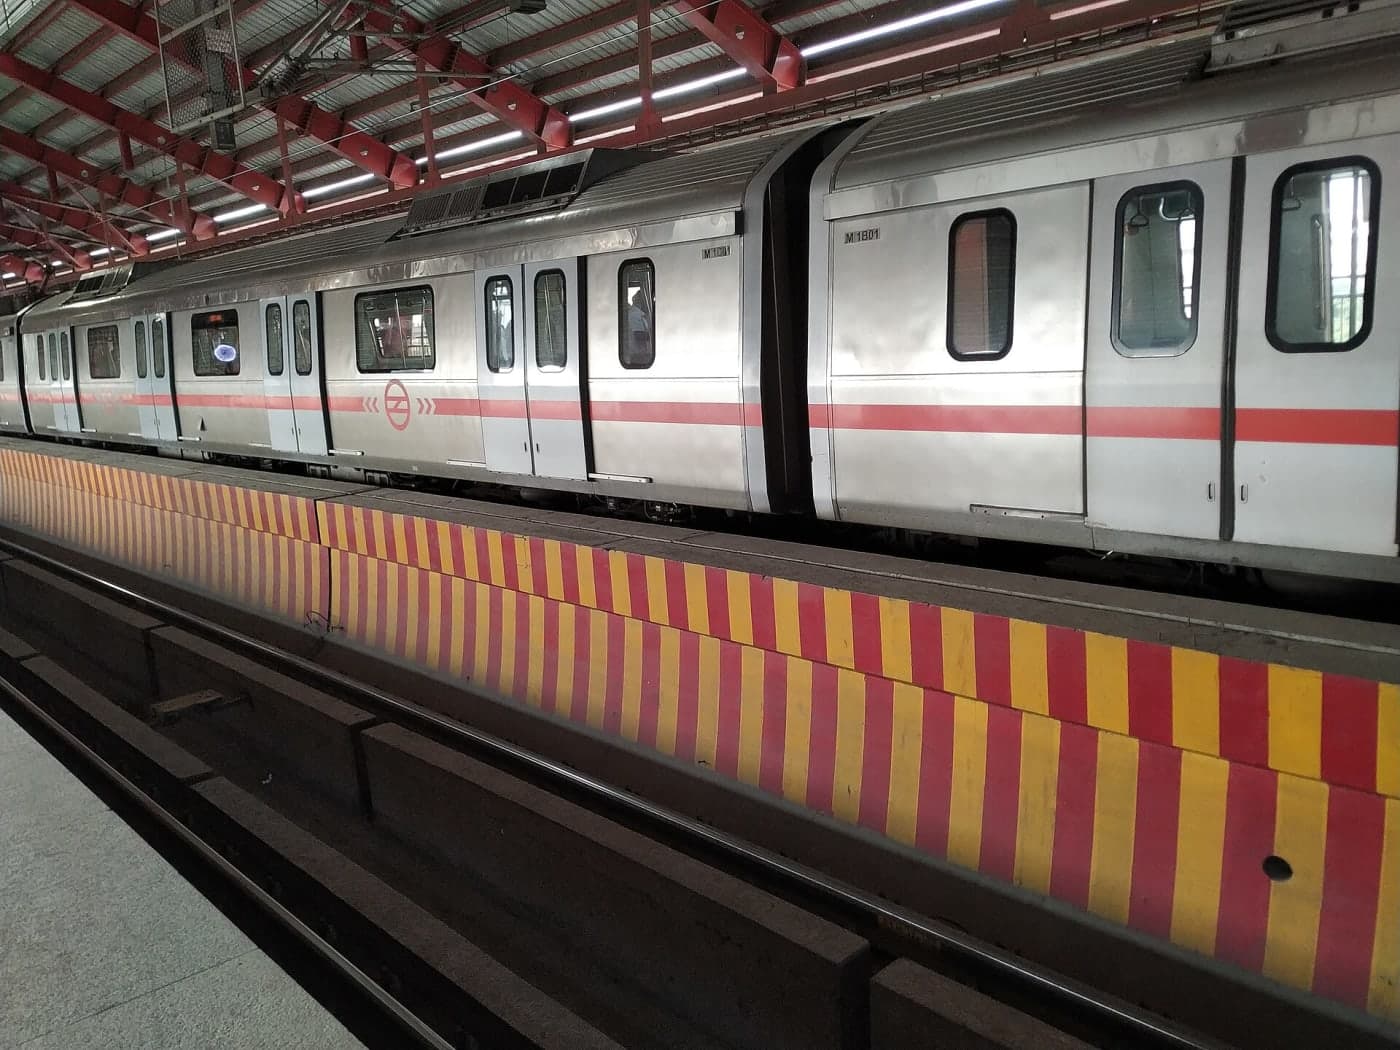
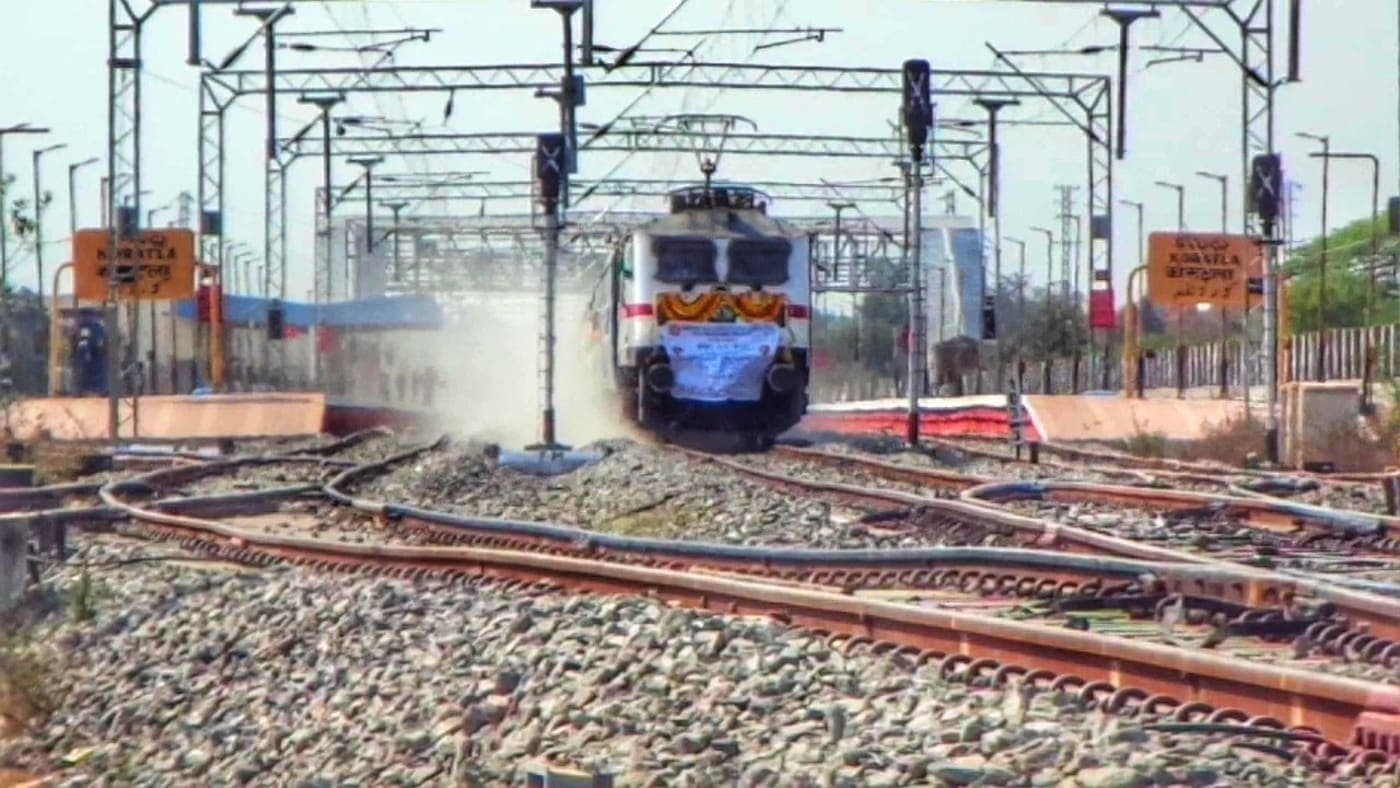
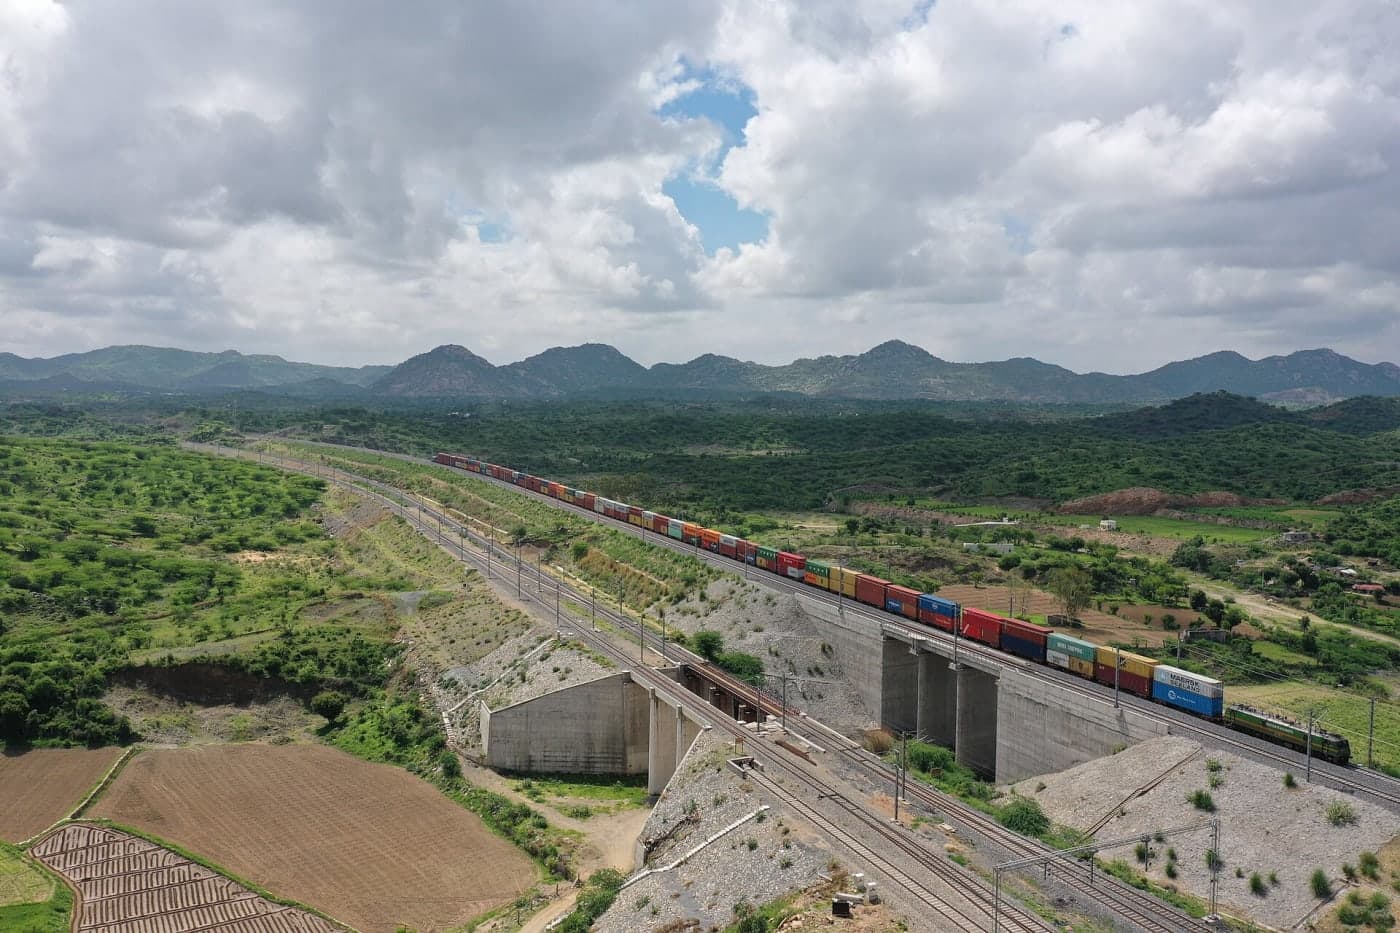
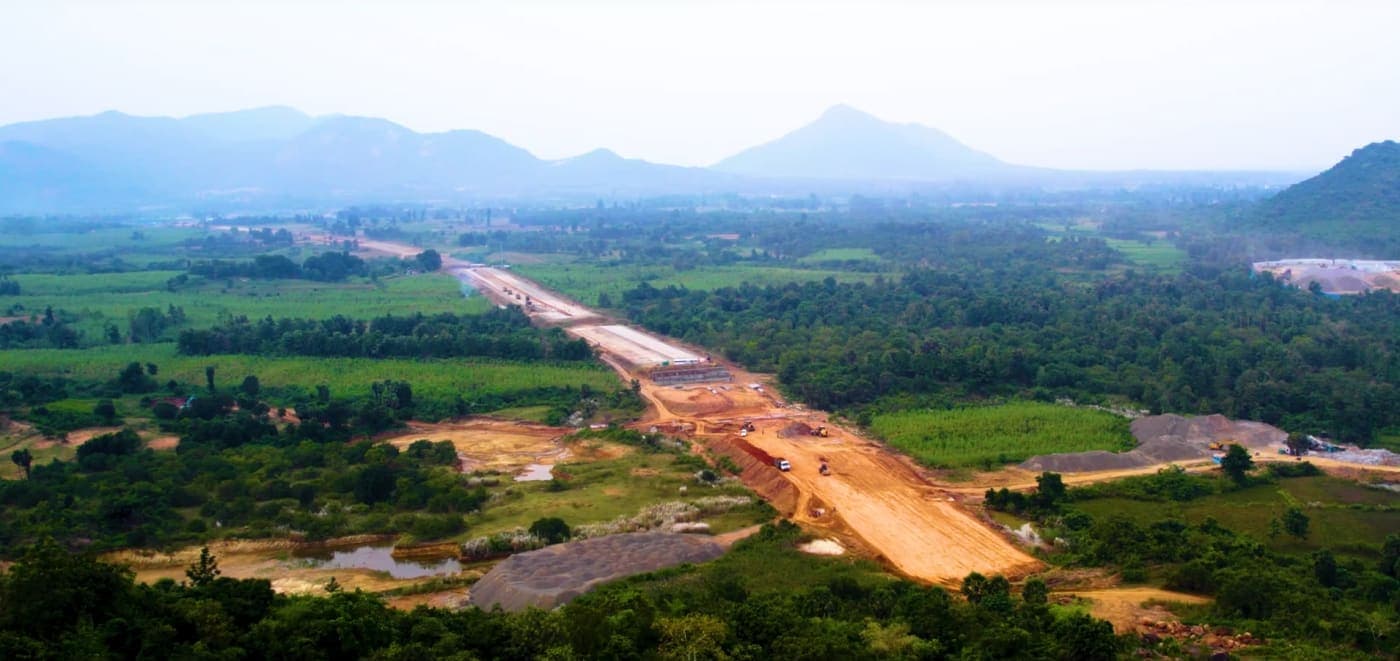
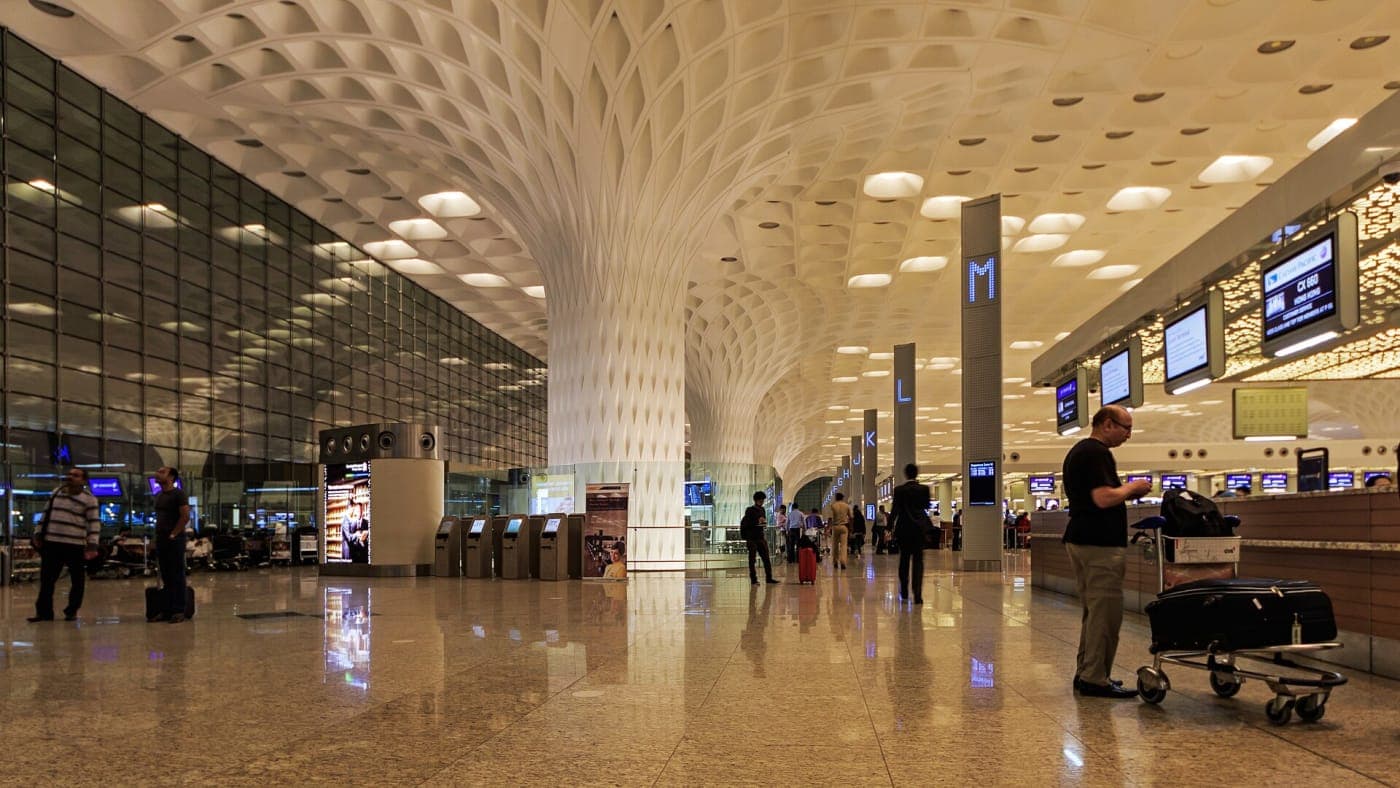
The numbers tell the story. Government capital spending on building the country jumped roughly six-fold — from about ₹2 lakh crore in 2014 to over ₹11 lakh crore today. National highways nearly doubled. Rail electrification leapt from around 40% to nearly 100%. Airports grew from 74 to 157. And UPI, a homegrown payments network, went from almost nothing to over 100 billion transactions a year.

India Unfolding maps, counts, and animates that transformation — across every sector, year by year — so you can watch a nation build itself.

Figures compiled from public sources — Union Budget, RBI, World Bank, MoRTH, Ministry of Railways, NPCI and others.

Connectivity & Transport
19 sectors

Water, Energy & Environment
24 sectors

Digital & Economy

39 sectors
Live
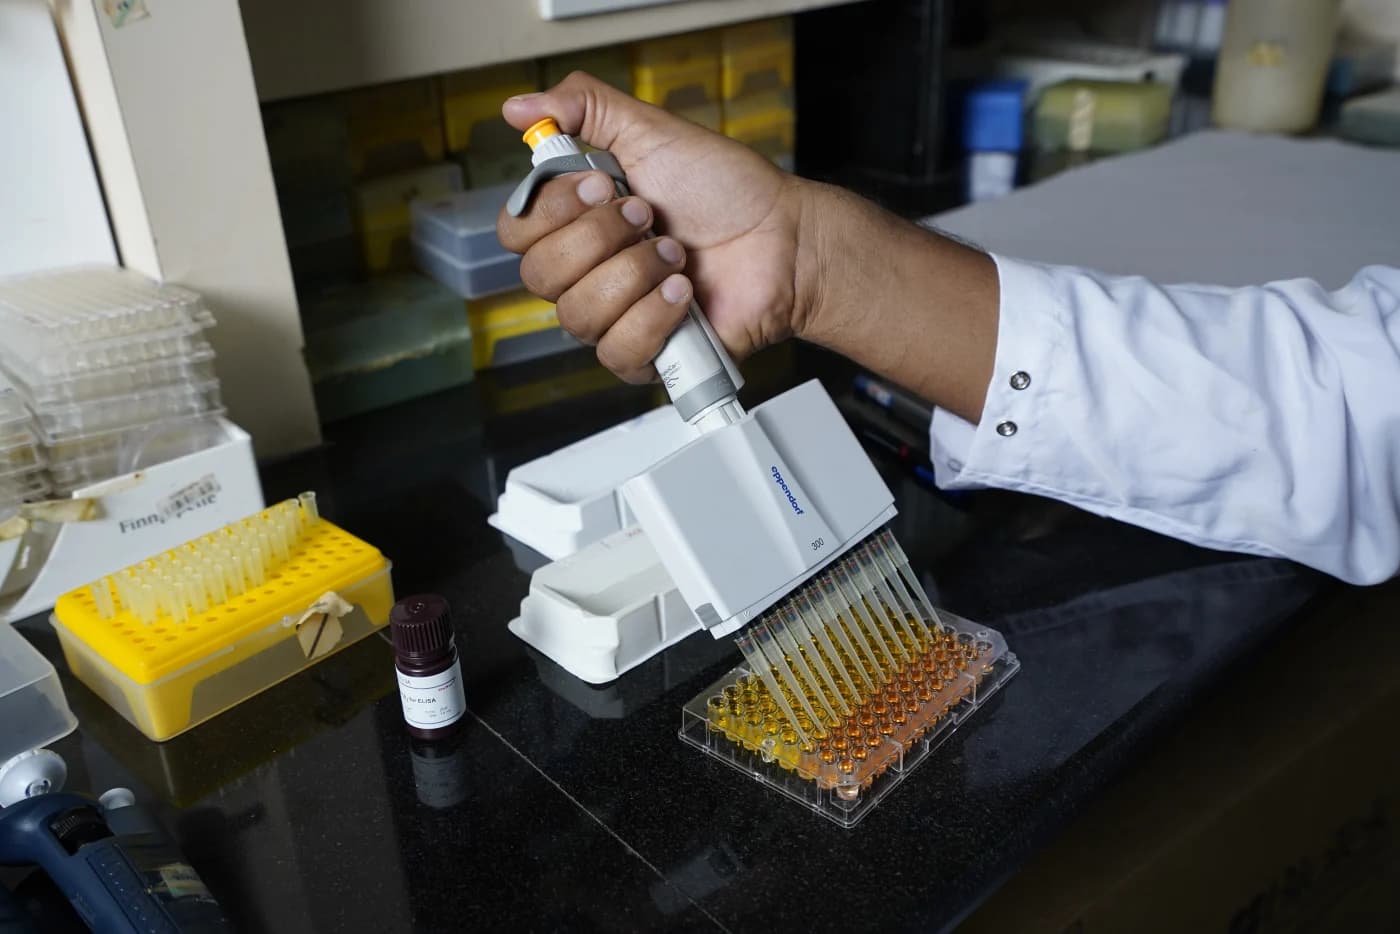
Medical Devices
$18 bn
Medical-device market (2024)
Live
Bio-economy · BioE3
$10 → $130 bn
Bio-economy (2014→2024)
Live
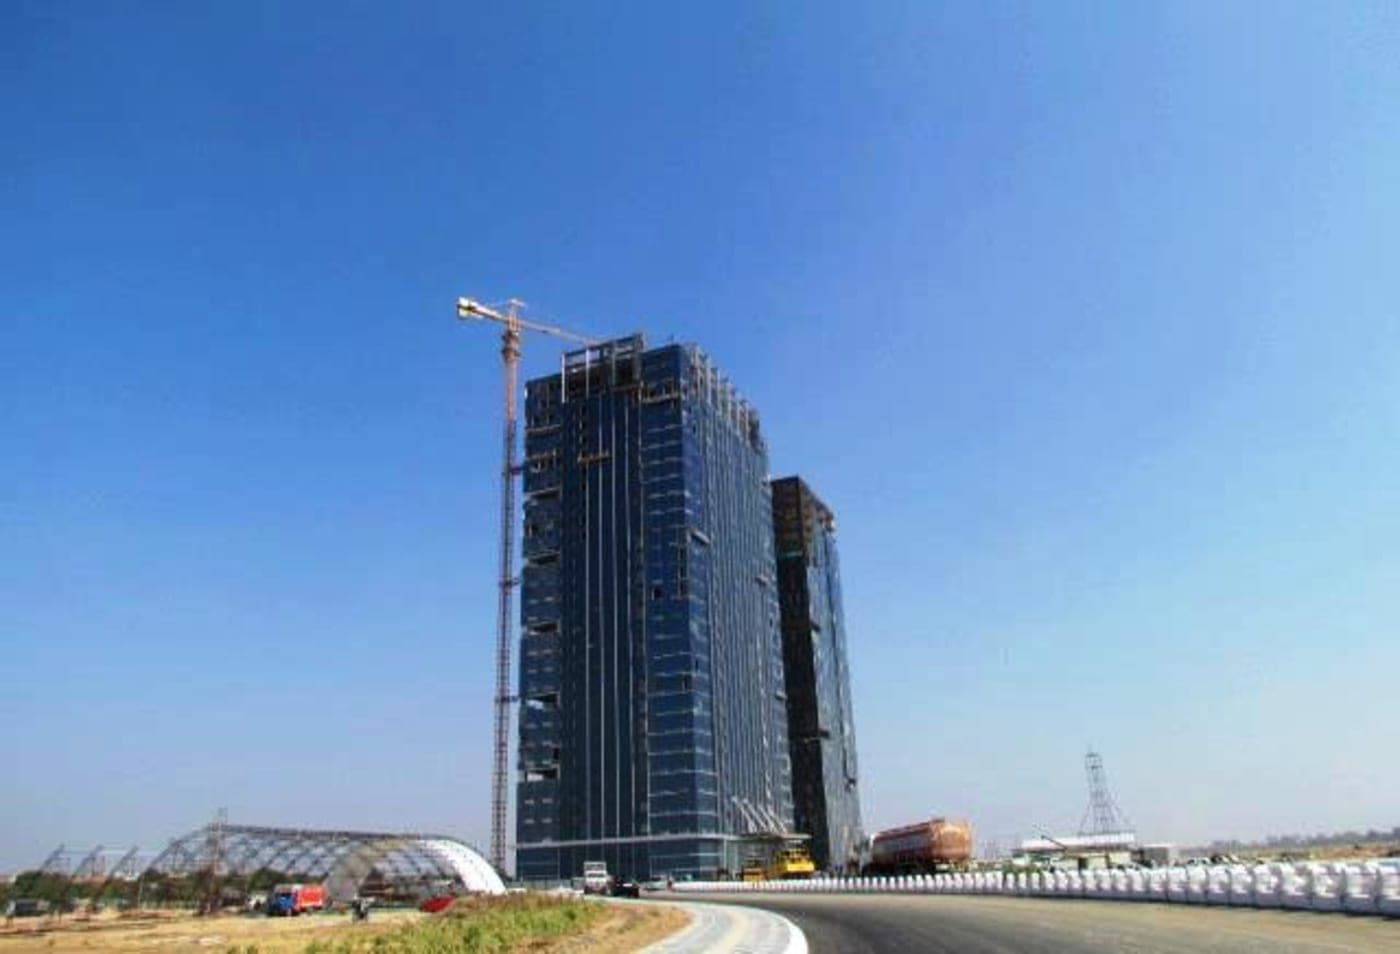
GIFT City · IFSC
$14 → $106 bn
IFSC banking assets
Live
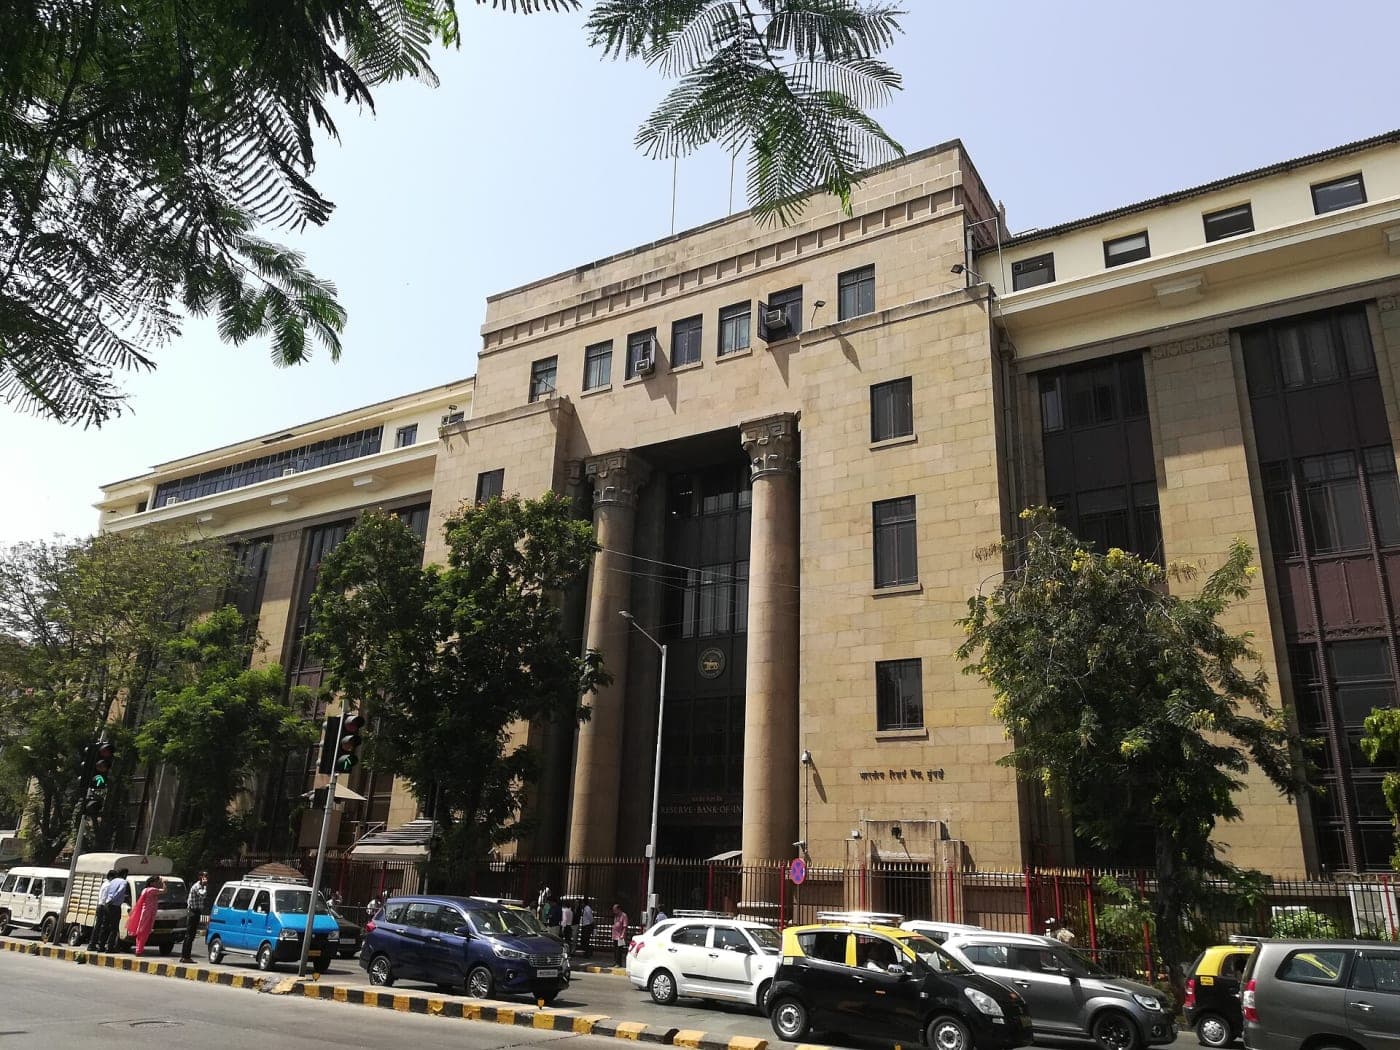
Digital Rupee · CBDC
~60 lakh
e-rupee users (2025)
Live
BharatNet · Rural Broadband
2.14 lakh
Gram panchayats connected
Live
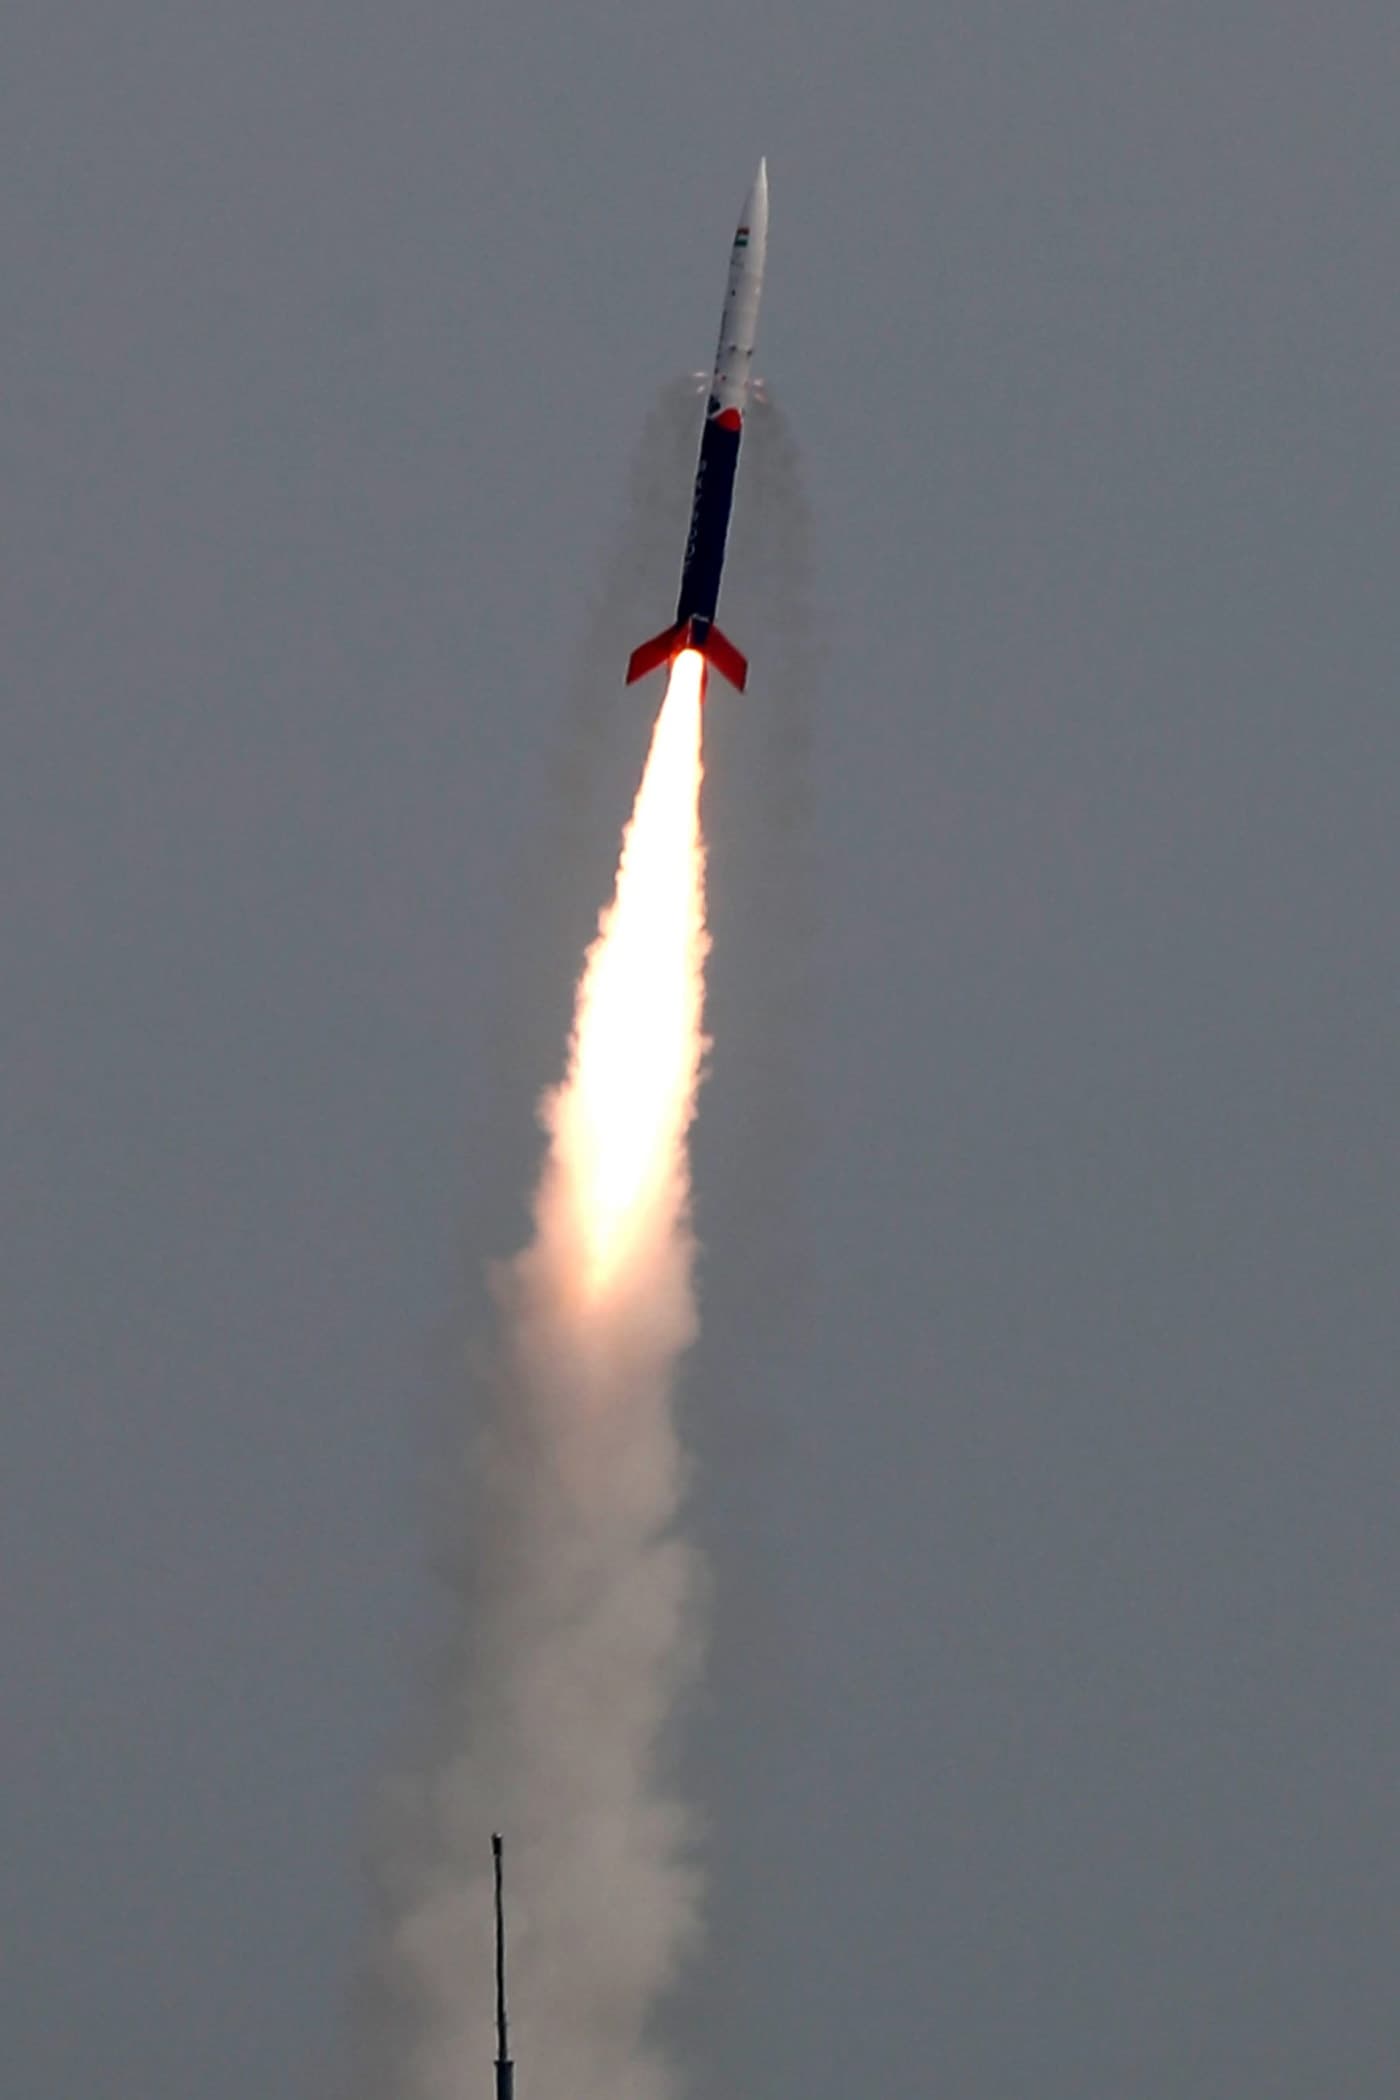
Private Space Launch
1 → 400+
Space-sector startups
Live
Digital Public Infra
0.9 → 228 B
UPI transactions / year
Live
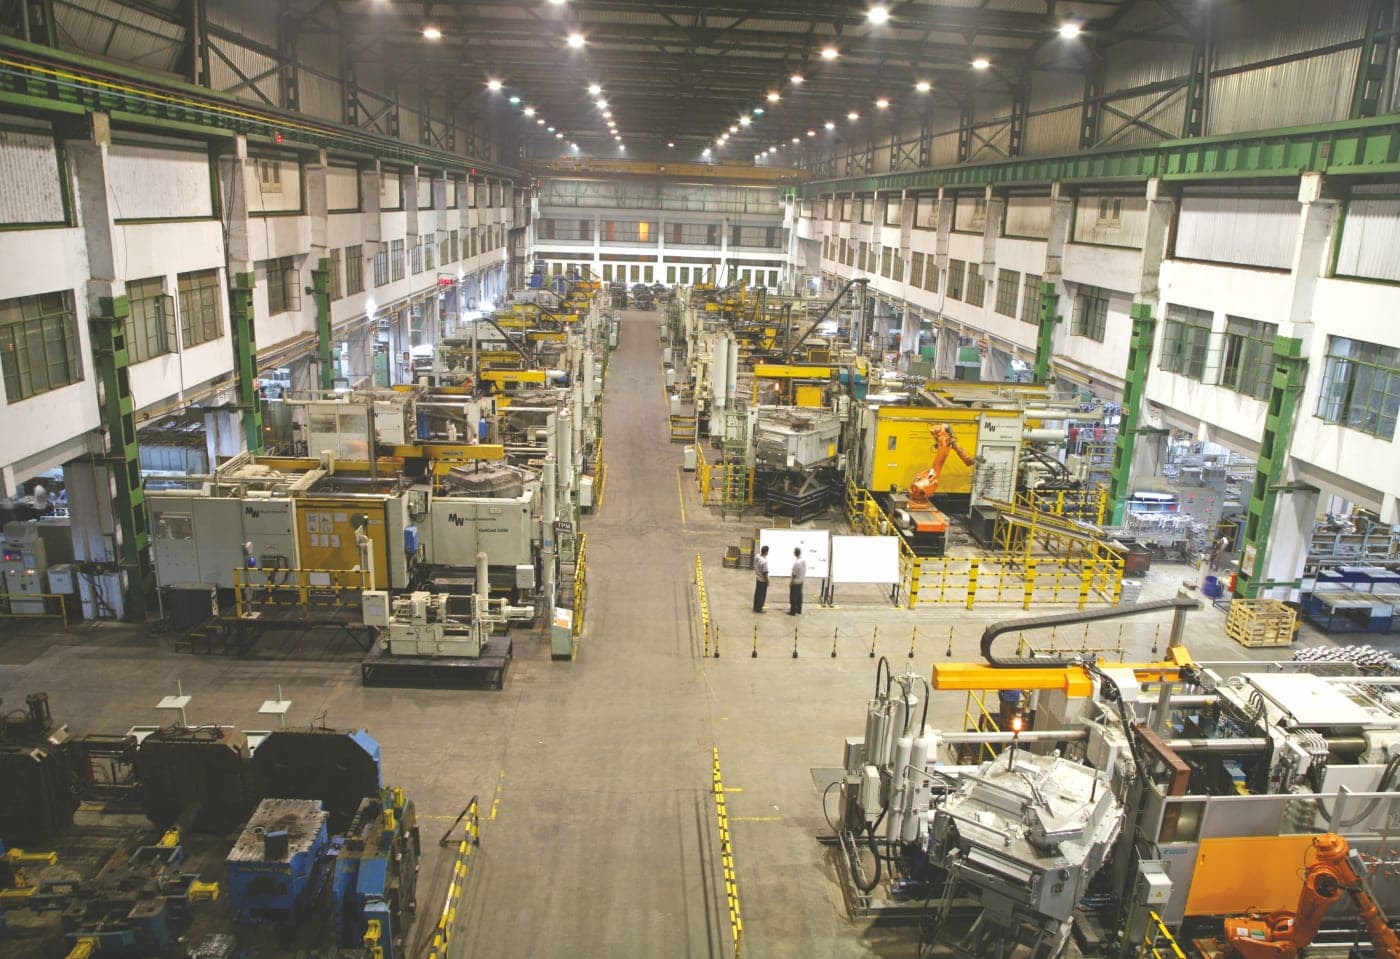
Make in India
₹1.9 → 11.3 L cr
Electronics production
Live
Semiconductors
₹1.6 lakh cr
Chip investment approved
Live
Quantum Technology
₹6,003 cr
National Quantum Mission
Live
Coal & Mining
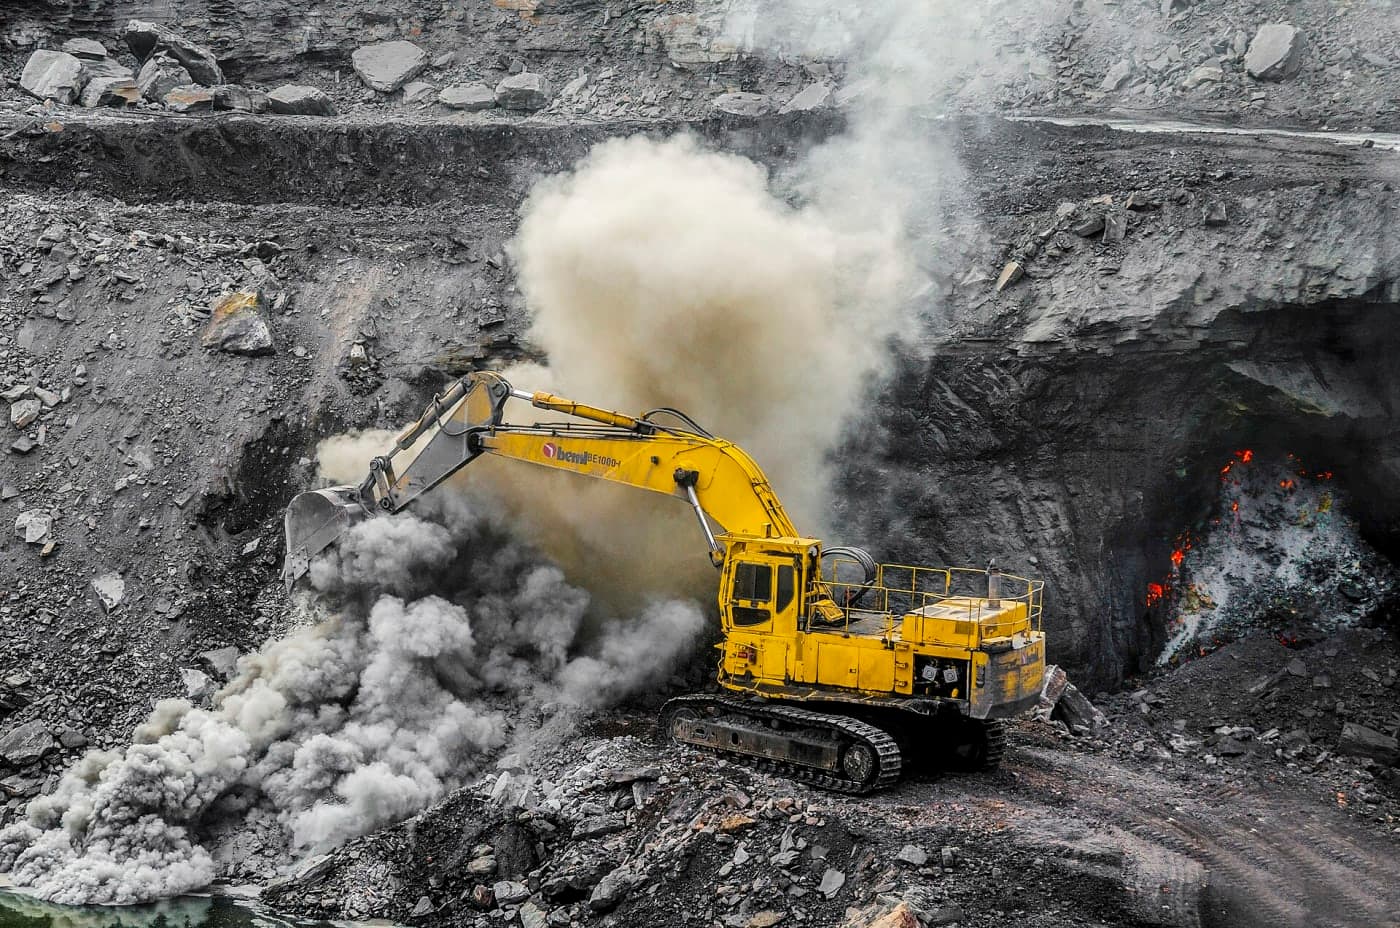
565 → 1,048 MT
Coal production
Live
Defence Exports
₹686 → 38,424 cr
Defence exports
Live
Startups & Unicorns
4 → 125
Unicorns
Live
Financial Inclusion
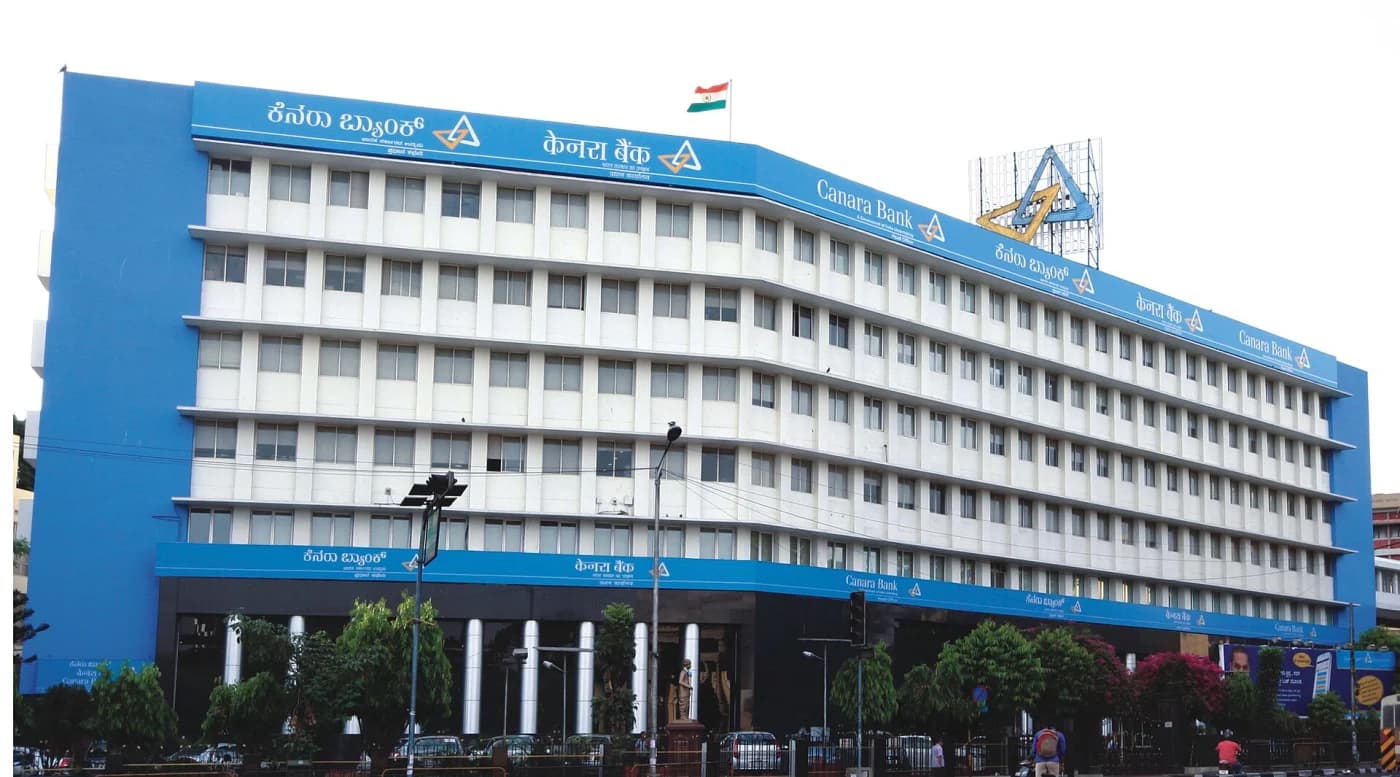
0 → 55 cr
Jan Dhan accounts
Live
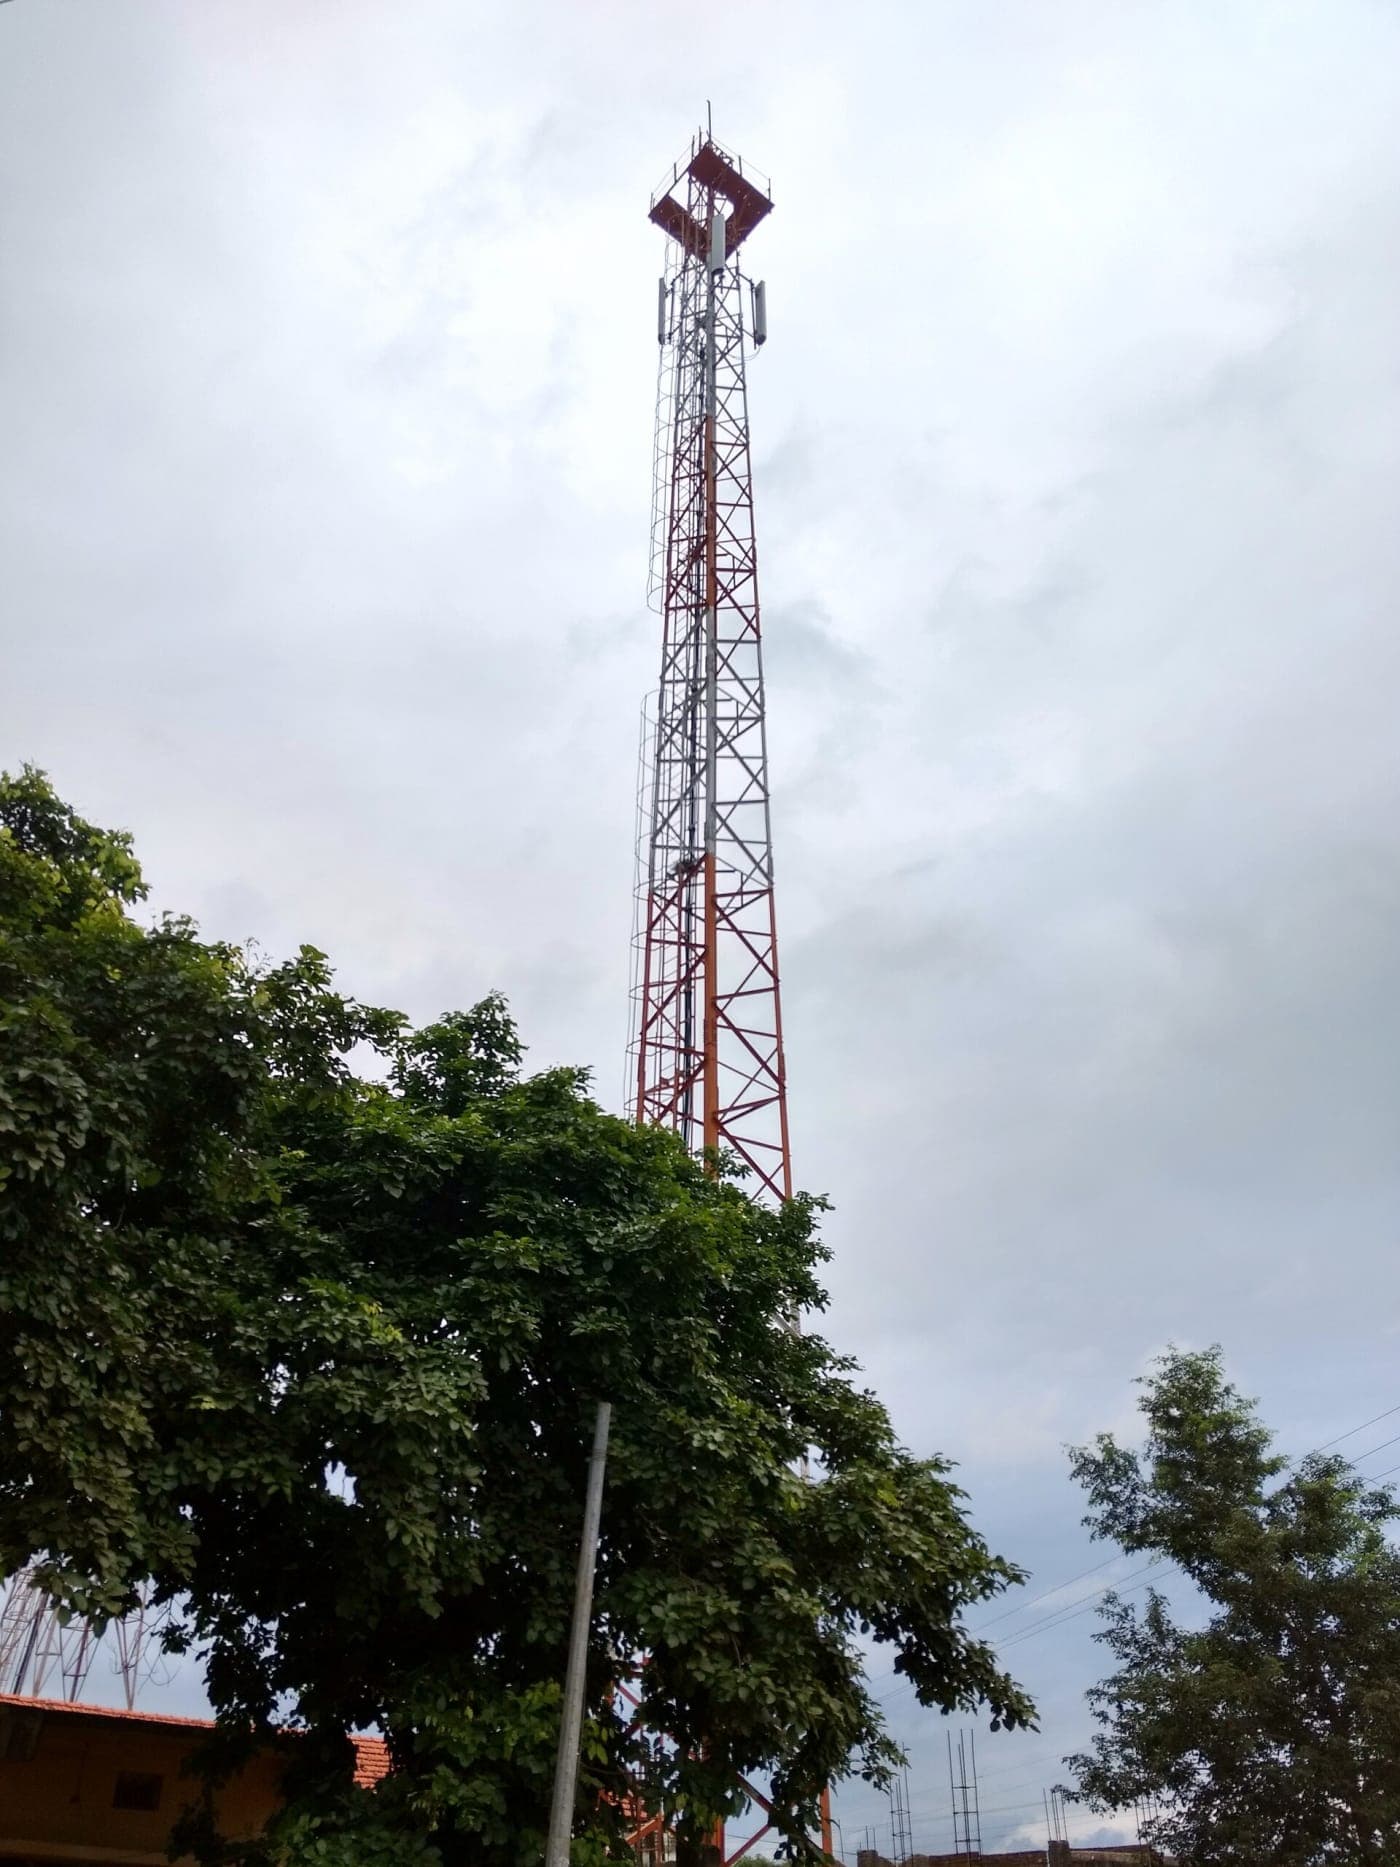
Telecom & 5G
25 → 97 cr
Internet subscribers
Live
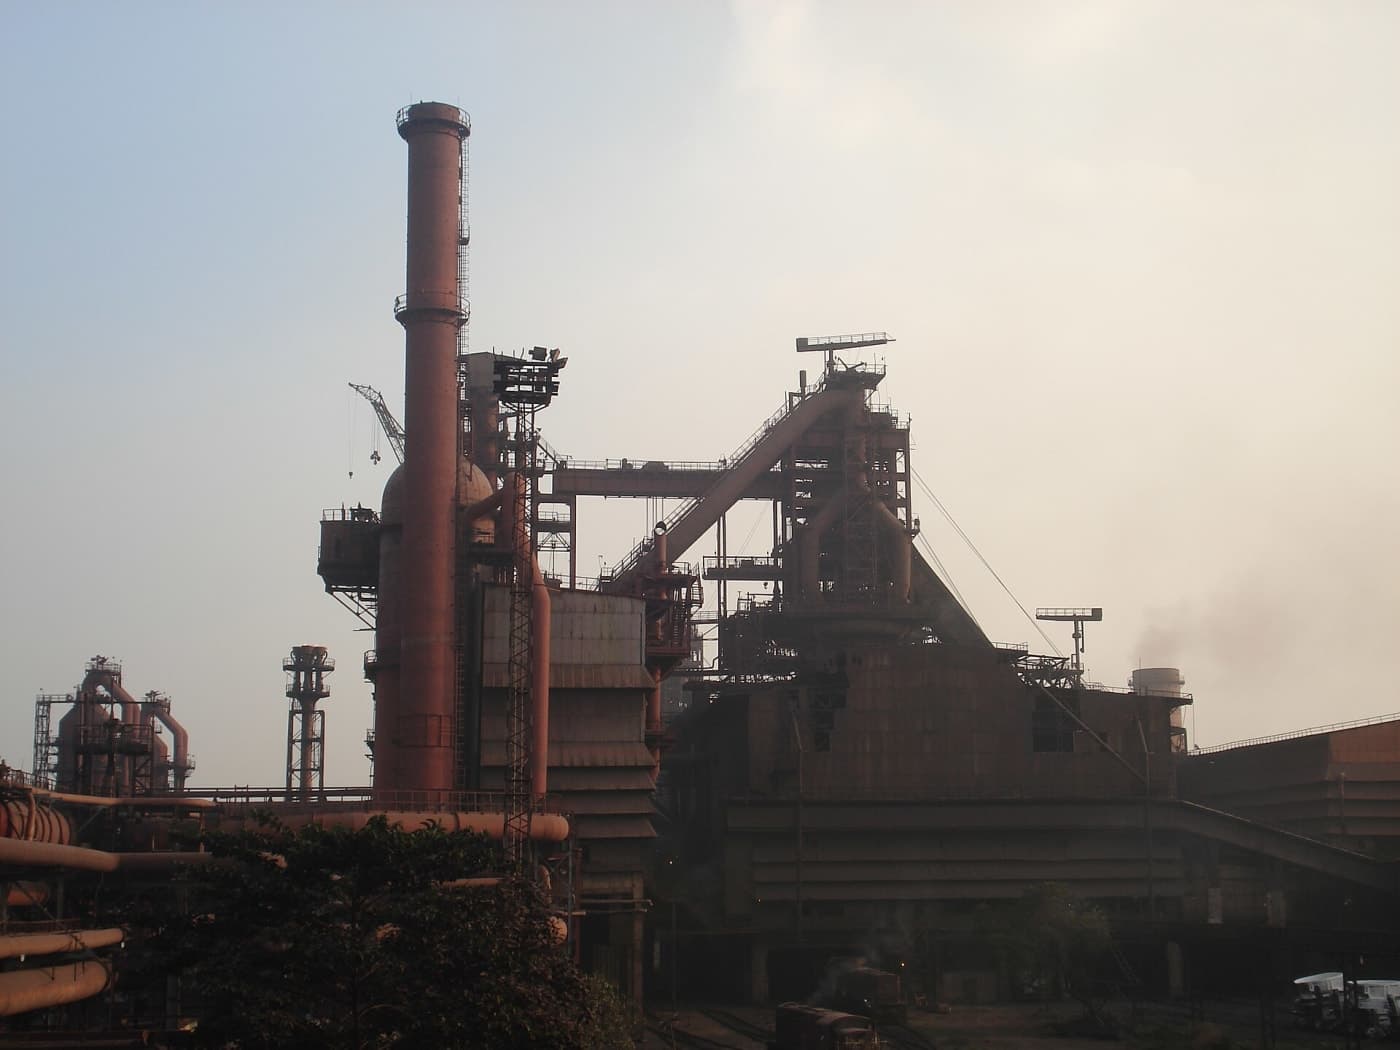
Steel & Core Industries
87 → 150 MT
Crude steel production
Live
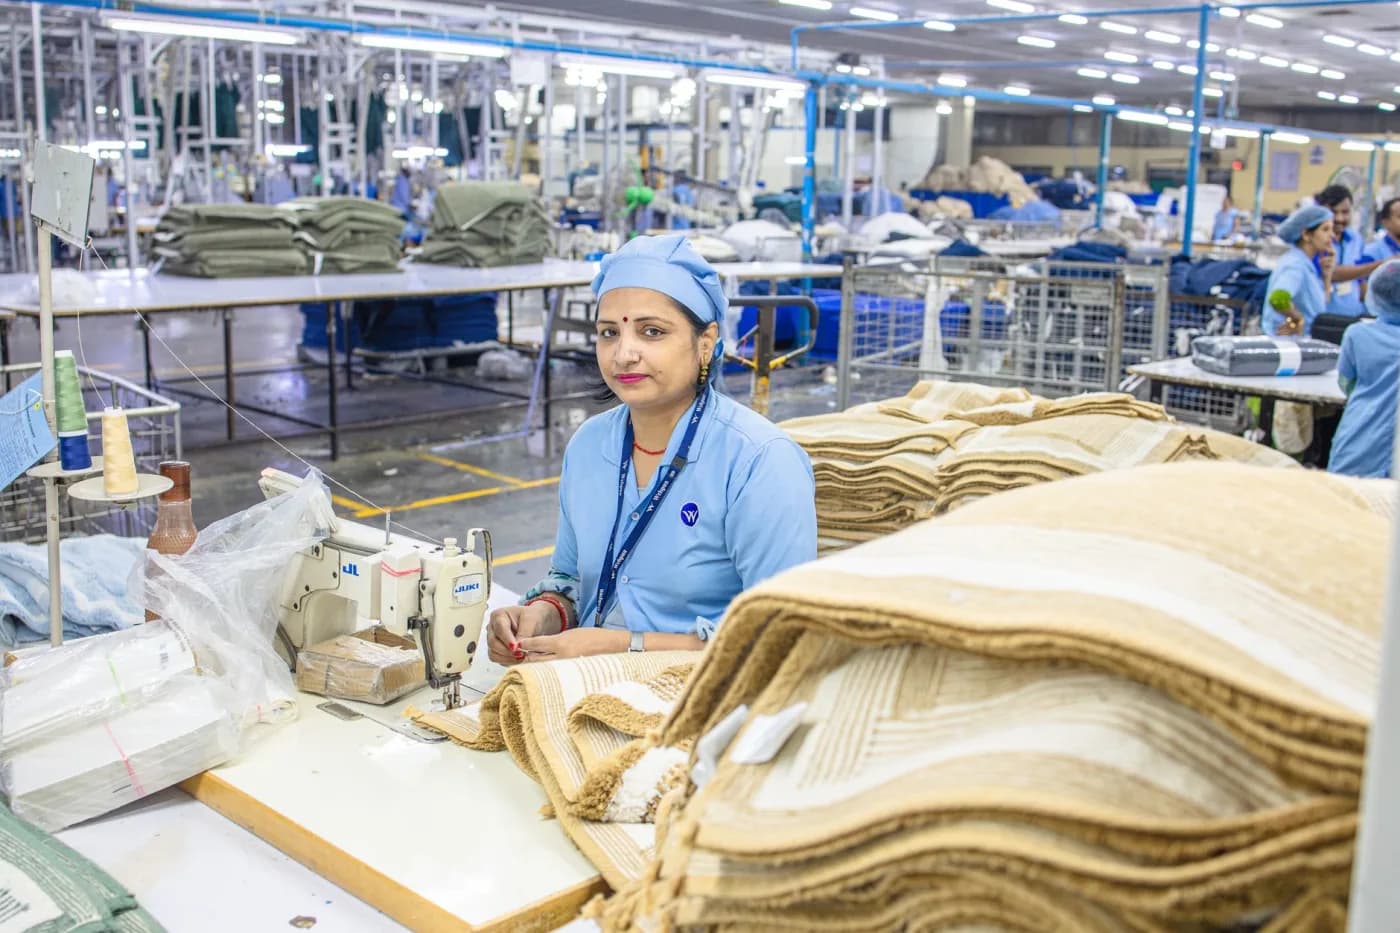
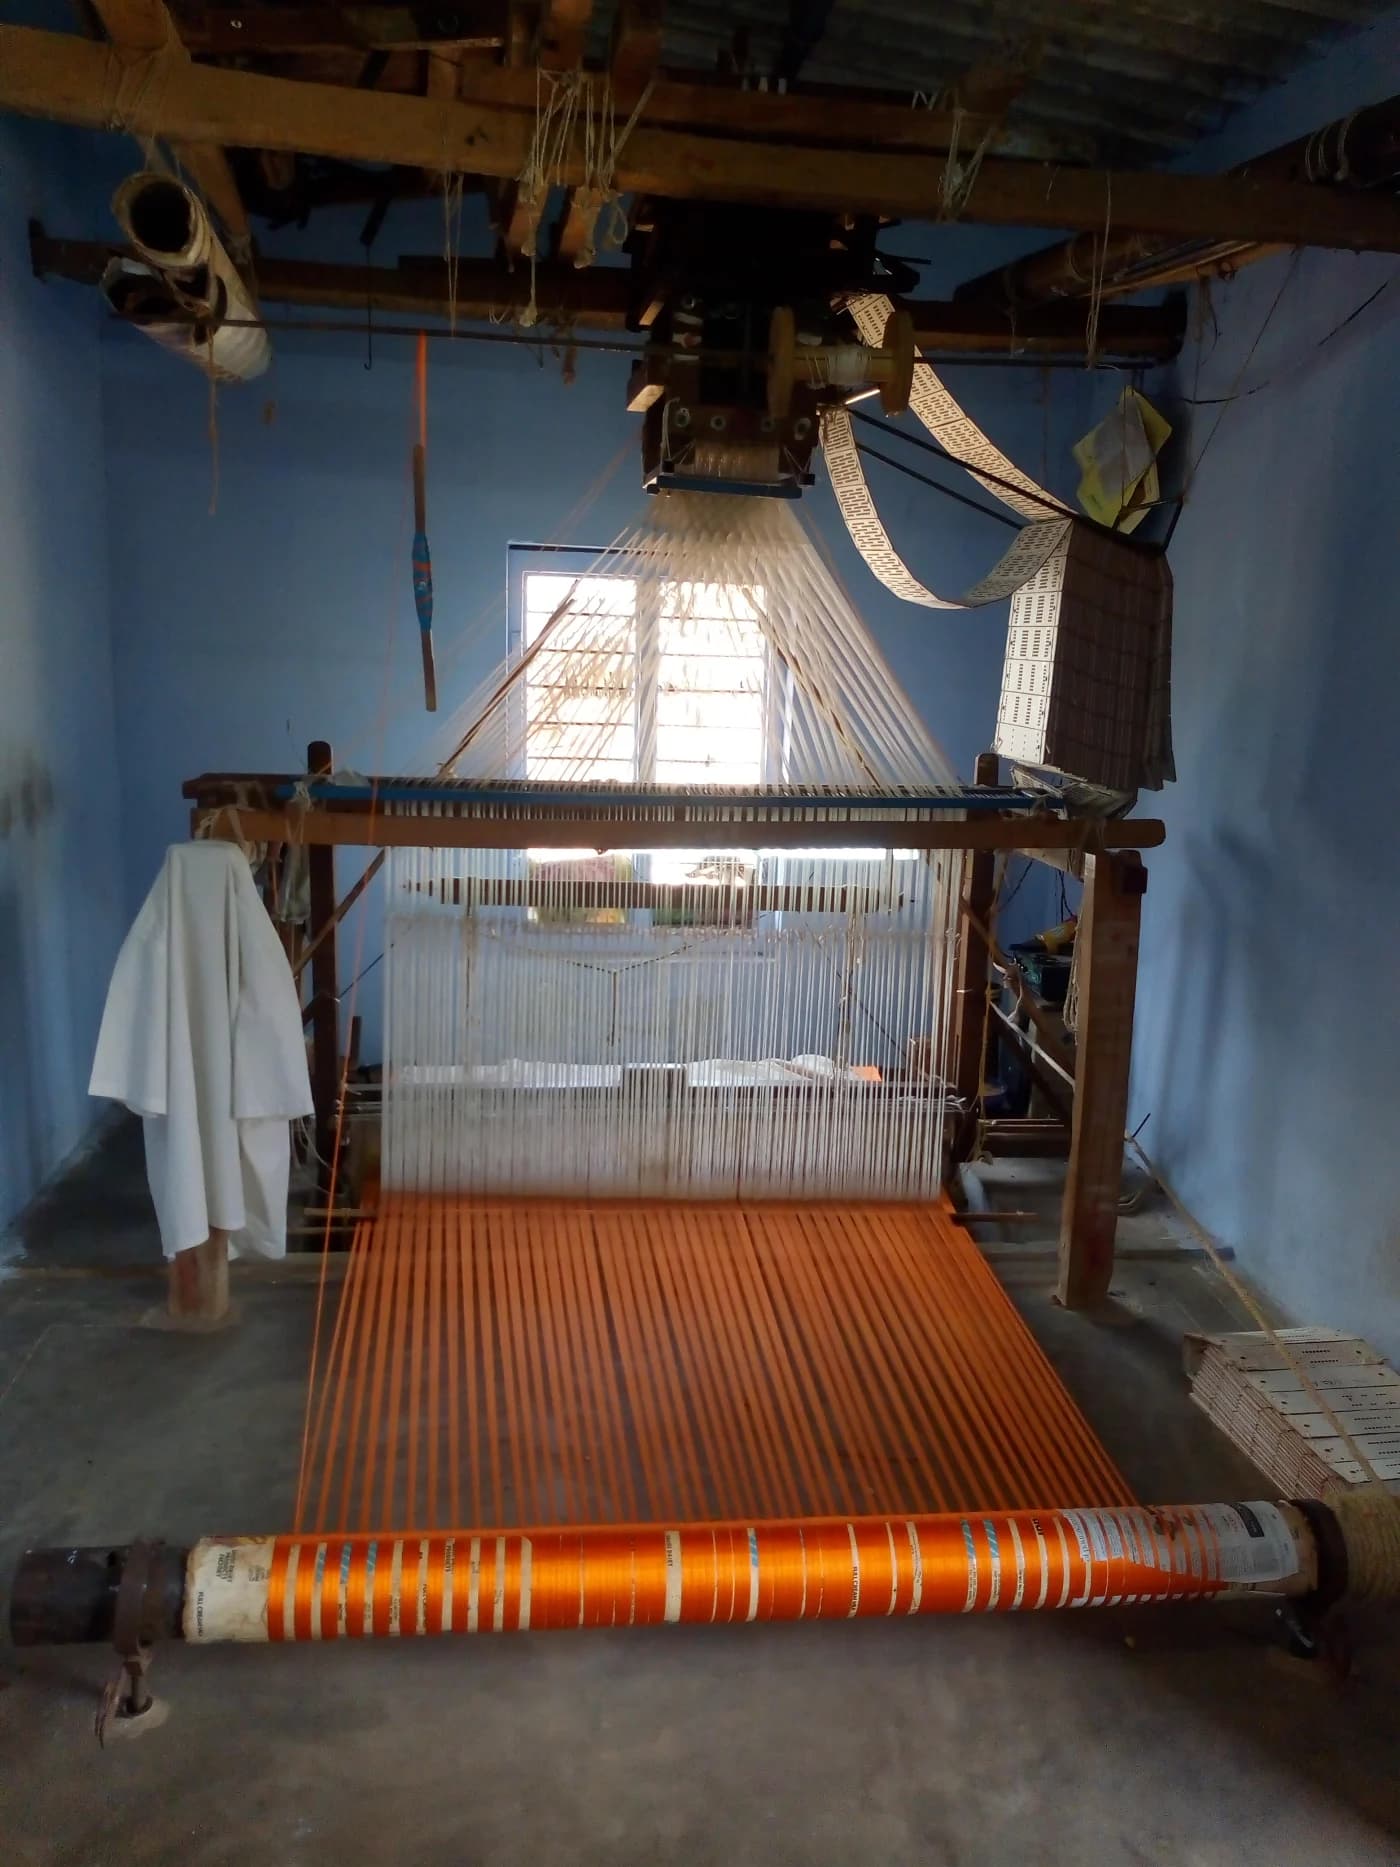
Textiles
~$100 → 175 bn
Textile & apparel market
Live
Food Processing
~$18 → 27 bn
Processed food exports
Live
Skill India
0 → 1.7 cr
Trained under PMKVY
Live
MSME Credit · Mudra
₹40 lakh cr
Mudra loans sanctioned
Live
e-Governance · Digital India
0 → 54 cr
DigiLocker users
Live
GST & Tax Base
₹7 → 22 lakh cr
Annual GST collections
Live
Forex Reserves
$304 → 700 bn
Foreign exchange reserves
Live
IT & Software Services
$99 → 205 bn
IT & software exports
Live
Pharmaceuticals
$12 → 30 bn
Pharma exports
Live
Capital Markets
2 → 22 cr
Demat accounts
Live
Gems & Jewellery
~$40 → 28 bn
Gems & jewellery exports
Live
Electronics Manufacturing
$30 → 127 bn
Electronics production
Live
The Economy · GDP
2.1 → 4.3
Nominal GDP (US$ trillion)
Live
Foreign Investment · FDI
45 → 81
Annual FDI inflows (US$ bn)
Live
Exports & Trade
466 → 825
Total exports (US$ bn)
Live
Research, Patents & Innovation
5,978 → 1,03,057
Patents granted / year
Live
Trade Deals · FTAs
10 → 16
Trade agreements (cumulative)
Live
Banking & Financial Reforms
11.2% → 2.2%
Gross bank NPA ratio
Live
Cooperatives · Sahakar
Sahakar
Cooperative movement
Live
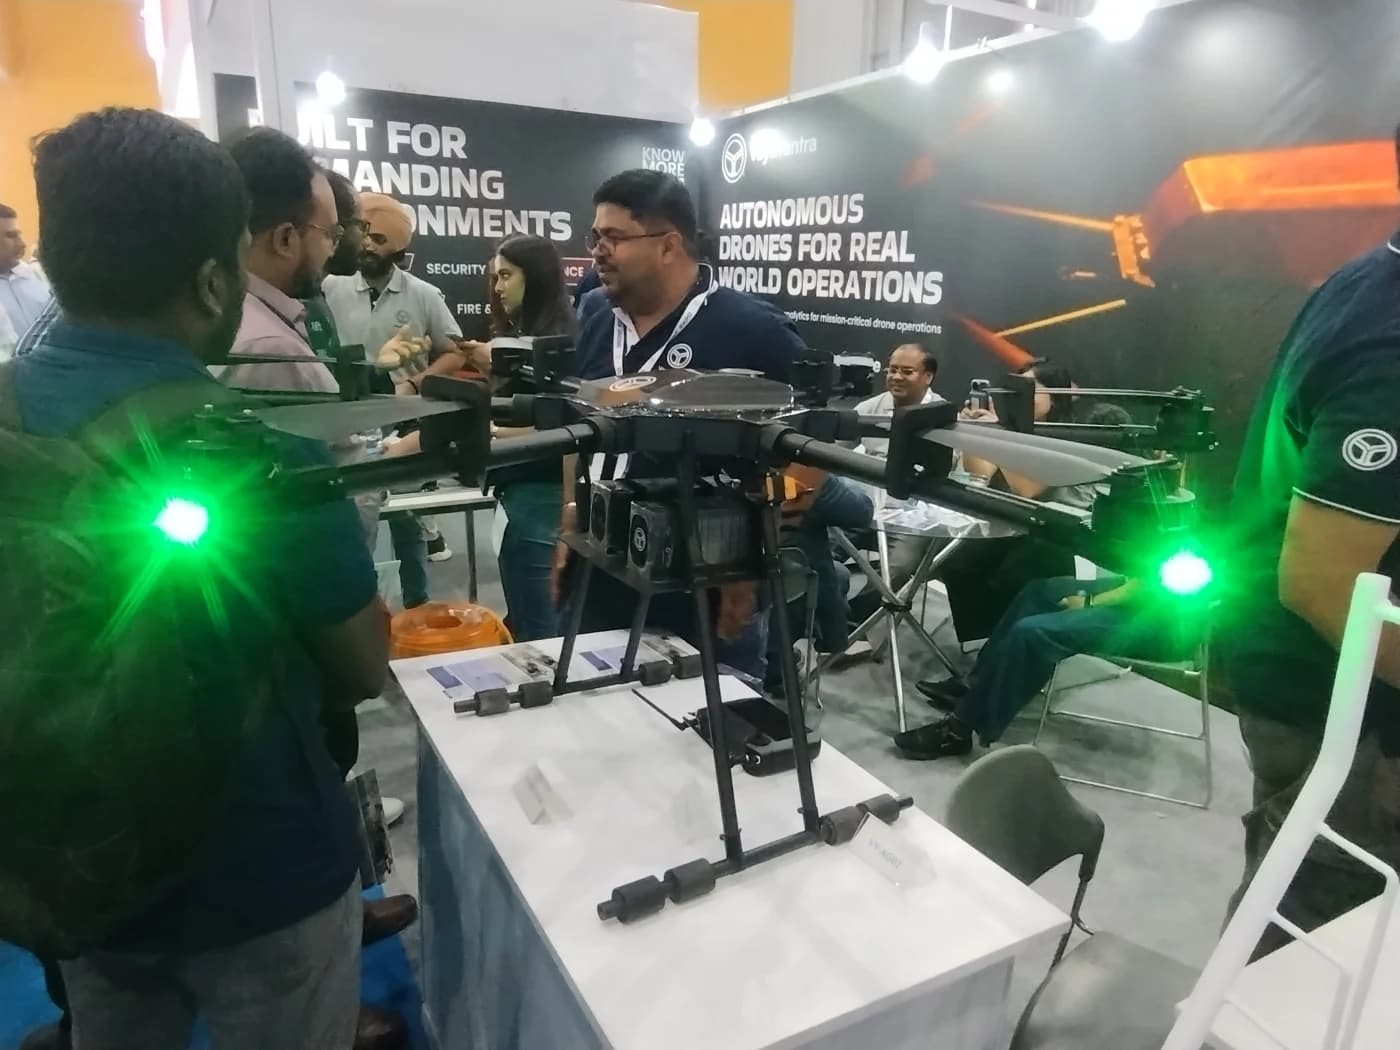
Drones · Drone Shakti
2030 hub
Global drone hub goal
Live
Data Protection & Cyber
DPDP 2023
Privacy & data rights
Live
Artificial Intelligence · IndiaAI
0 → 38k+
AI compute (GPUs)
Live
e-Commerce · ONDC
ONDC
Open digital commerce

People & Nation

31 sectors
Live
Media, Cinema & OTT
Rs 2.5 lakh cr
M&E sector (2024)
Live
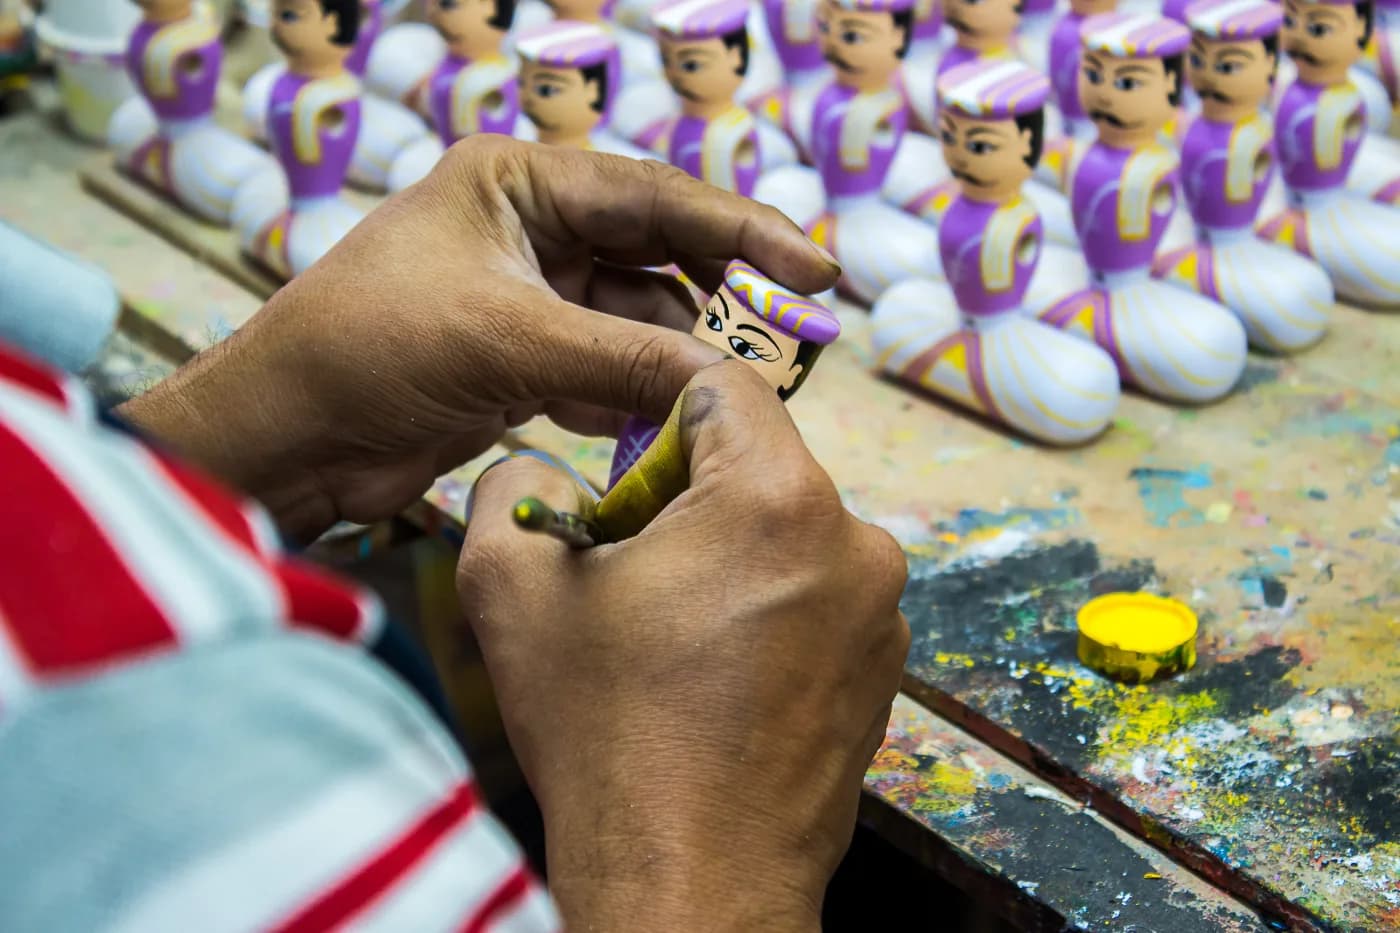
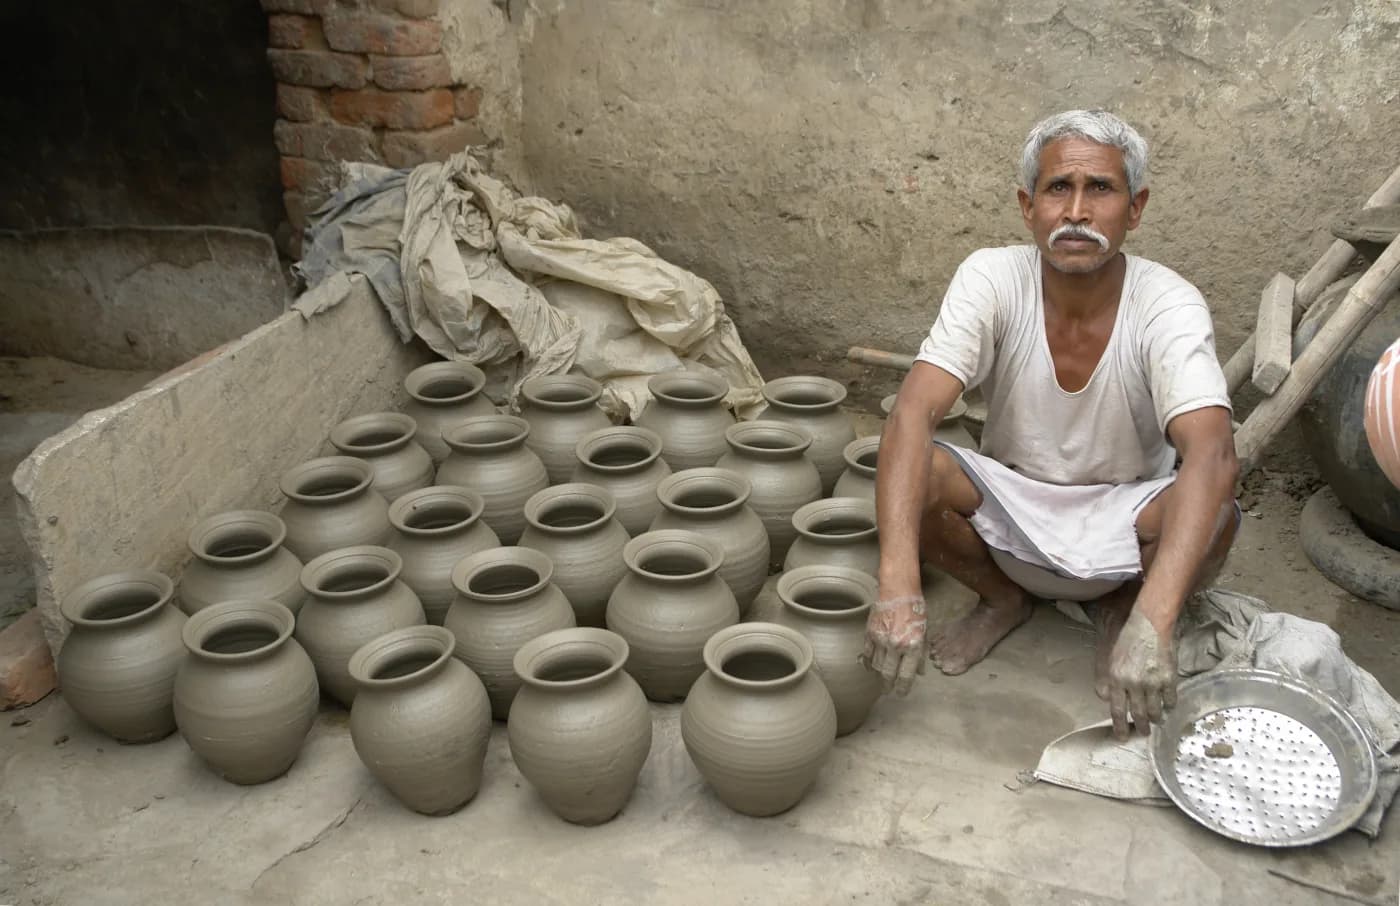
PM Vishwakarma · Artisans
18 trades
Traditional crafts covered
Live
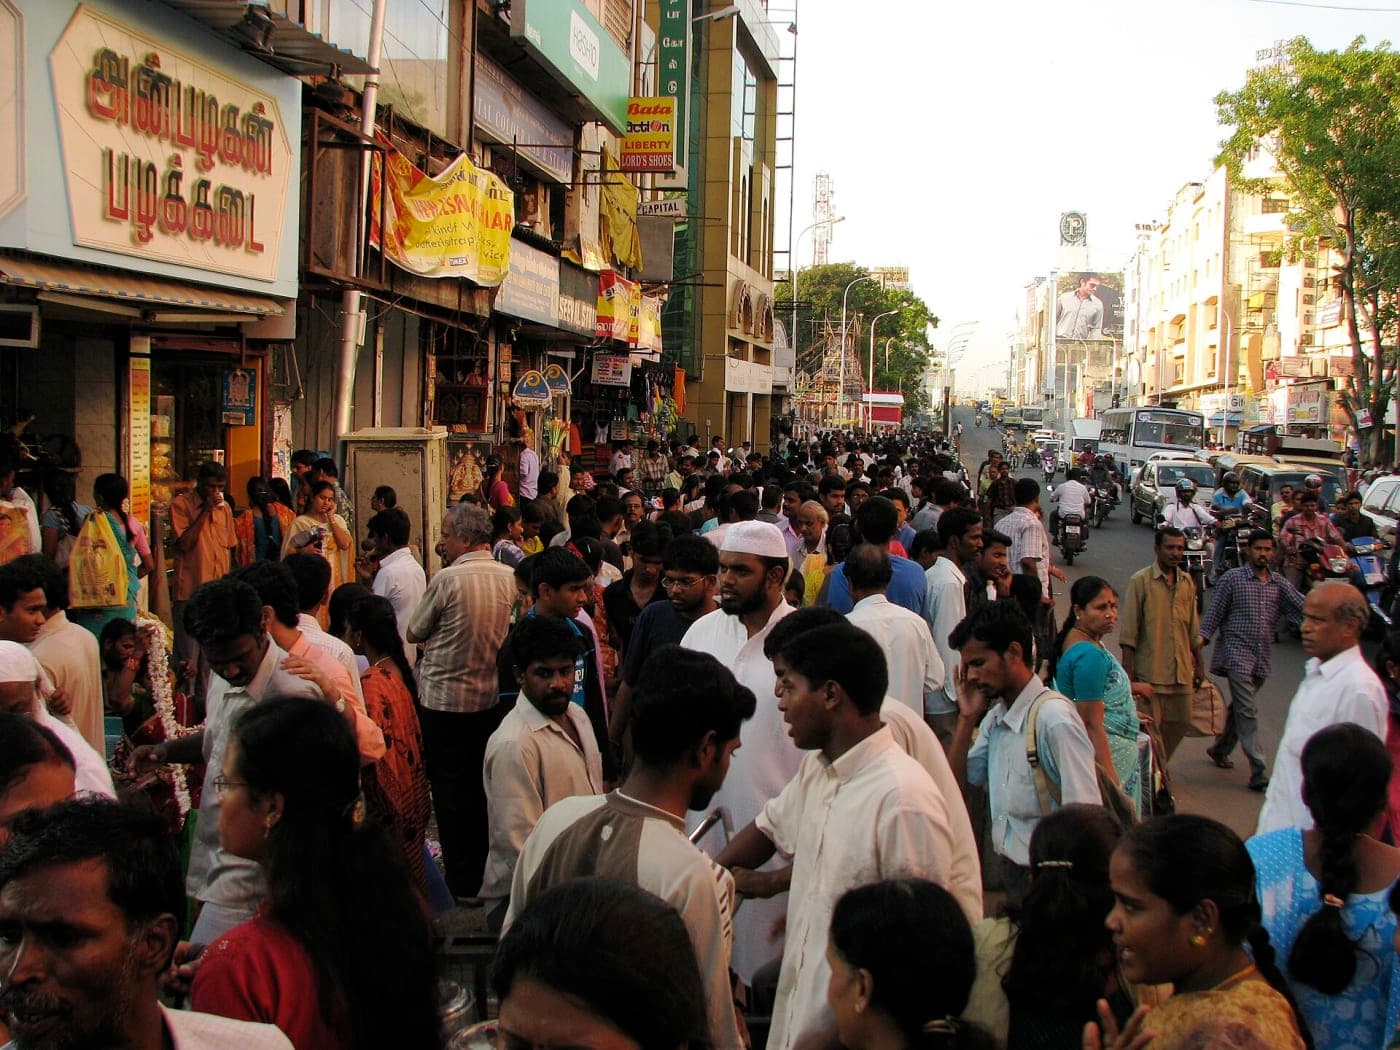
Census & Demography
~142 cr
Population (2027, est.)
Live
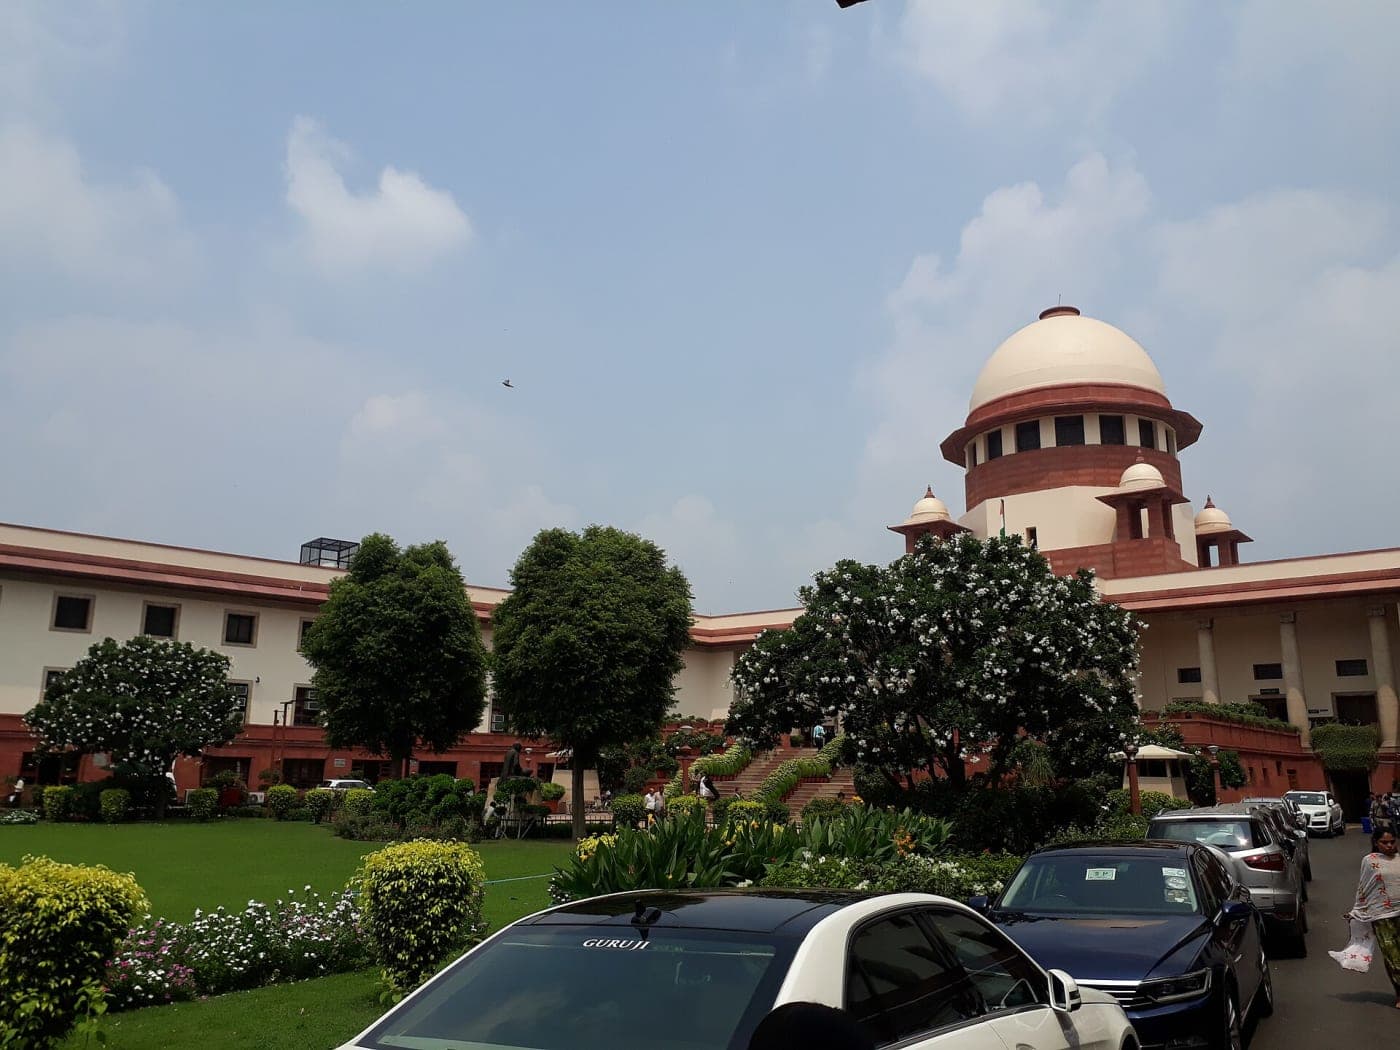
Justice & Legal Reform
IPC → BNS
Colonial codes replaced (2024)
Live
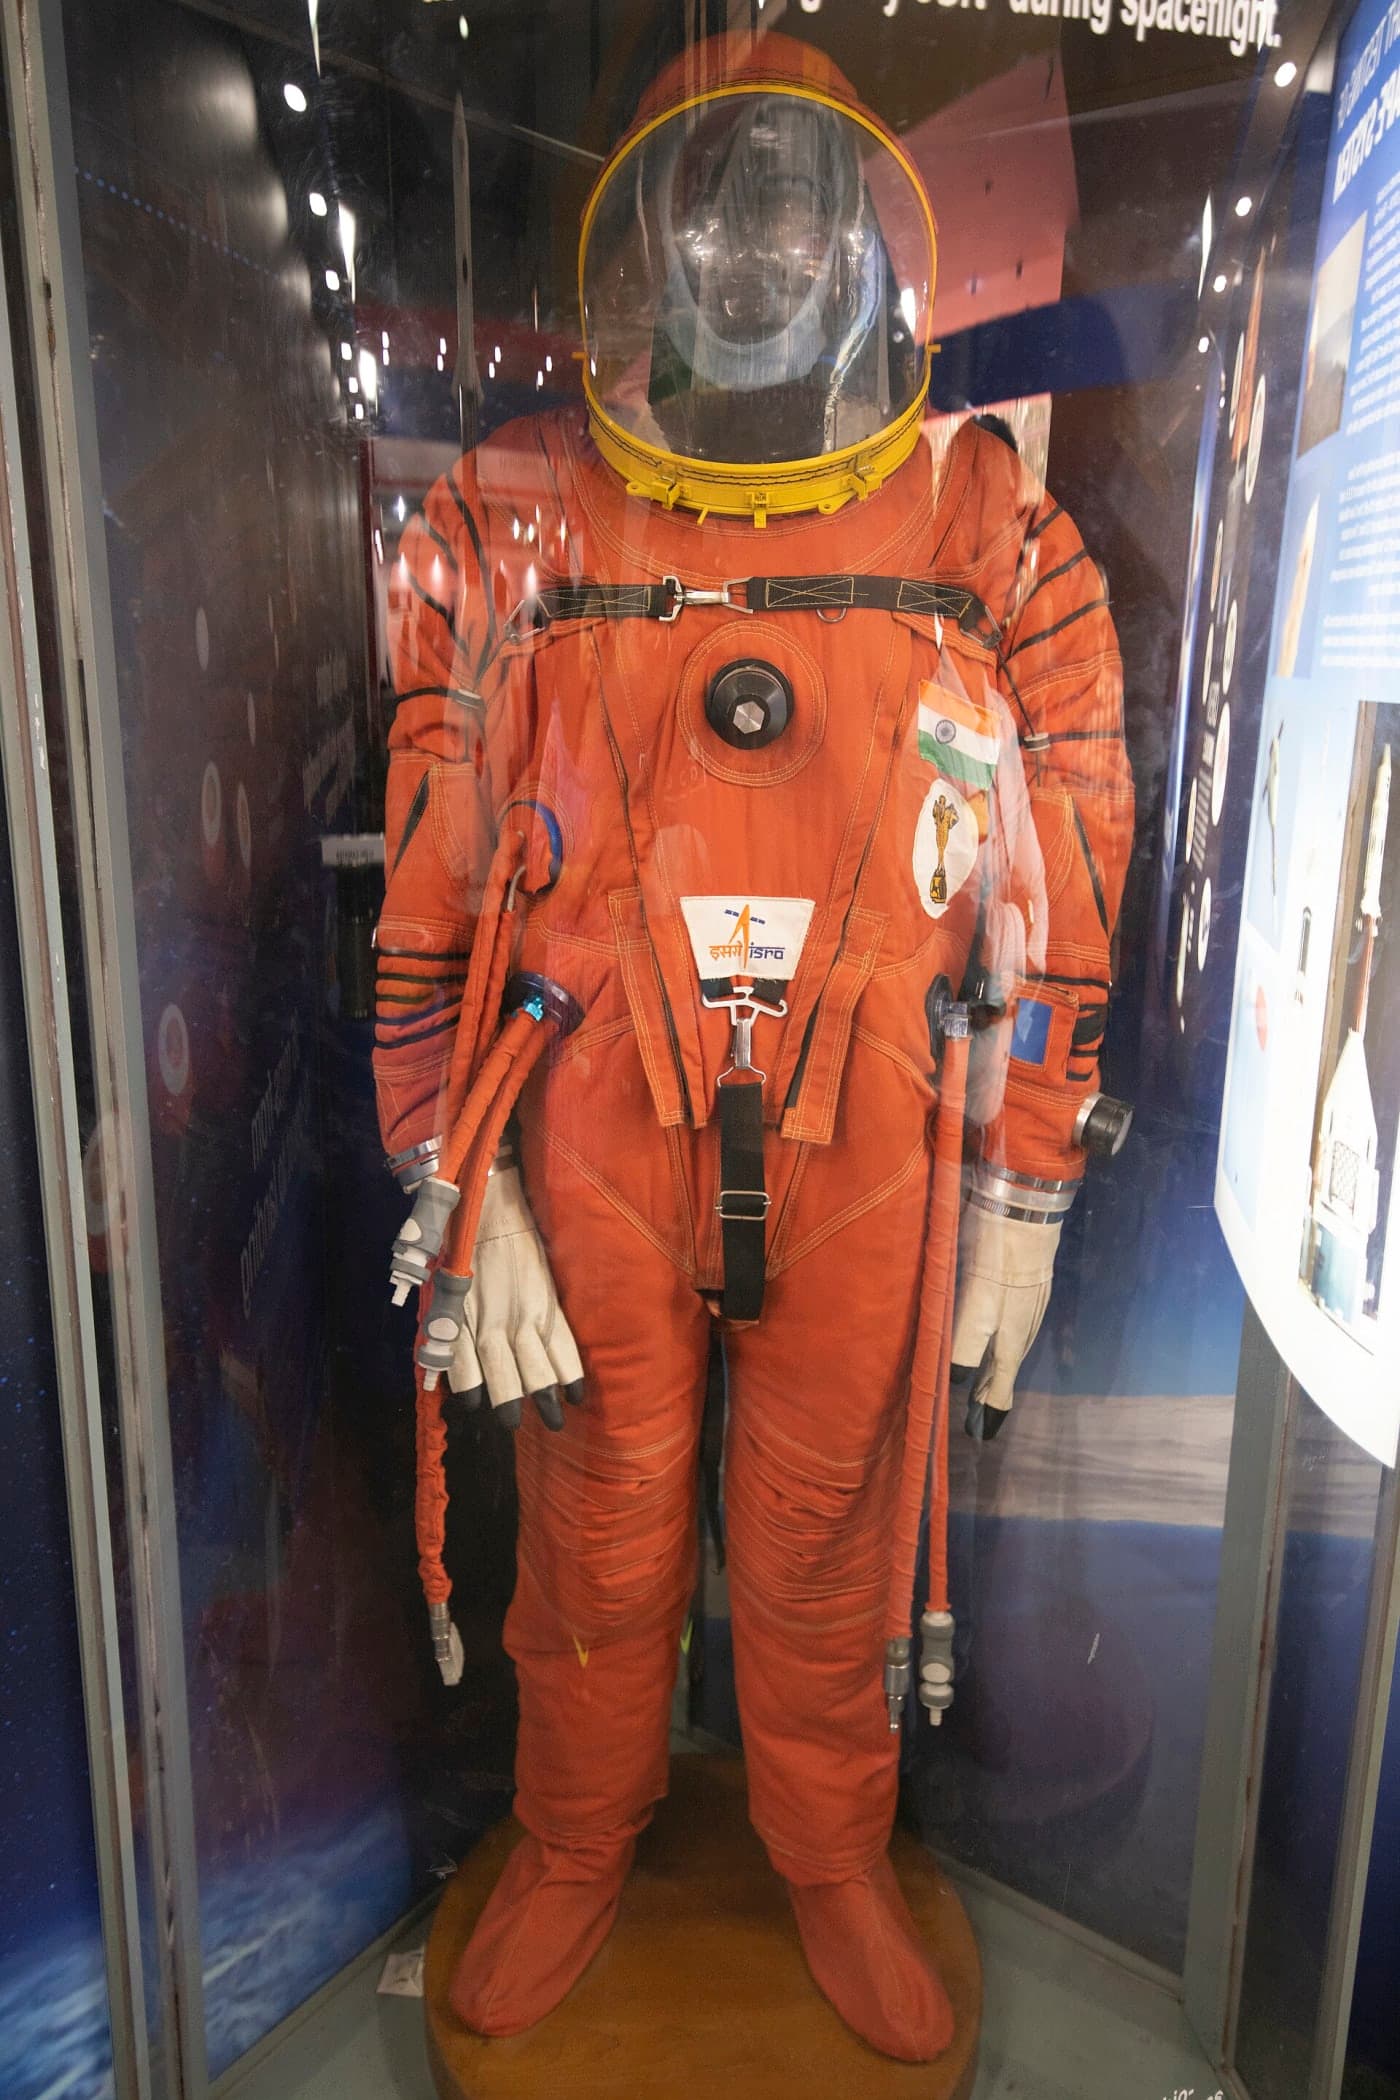
Gaganyaan · Human Spaceflight
2027
First crewed mission (target)
Live
Diplomacy & Global Standing
G20 host · 2023
India's global standing
Live
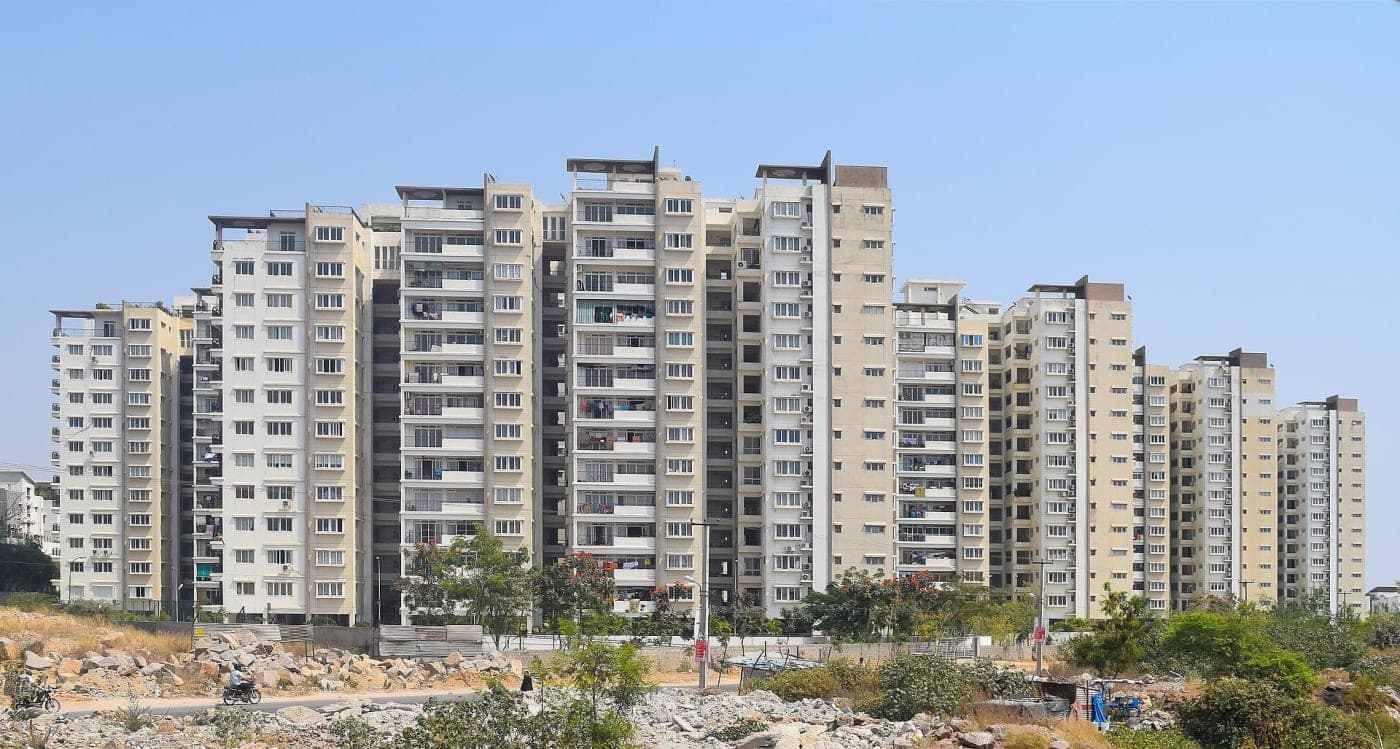
Housing
0 → 4 cr
PMAY houses built
Live
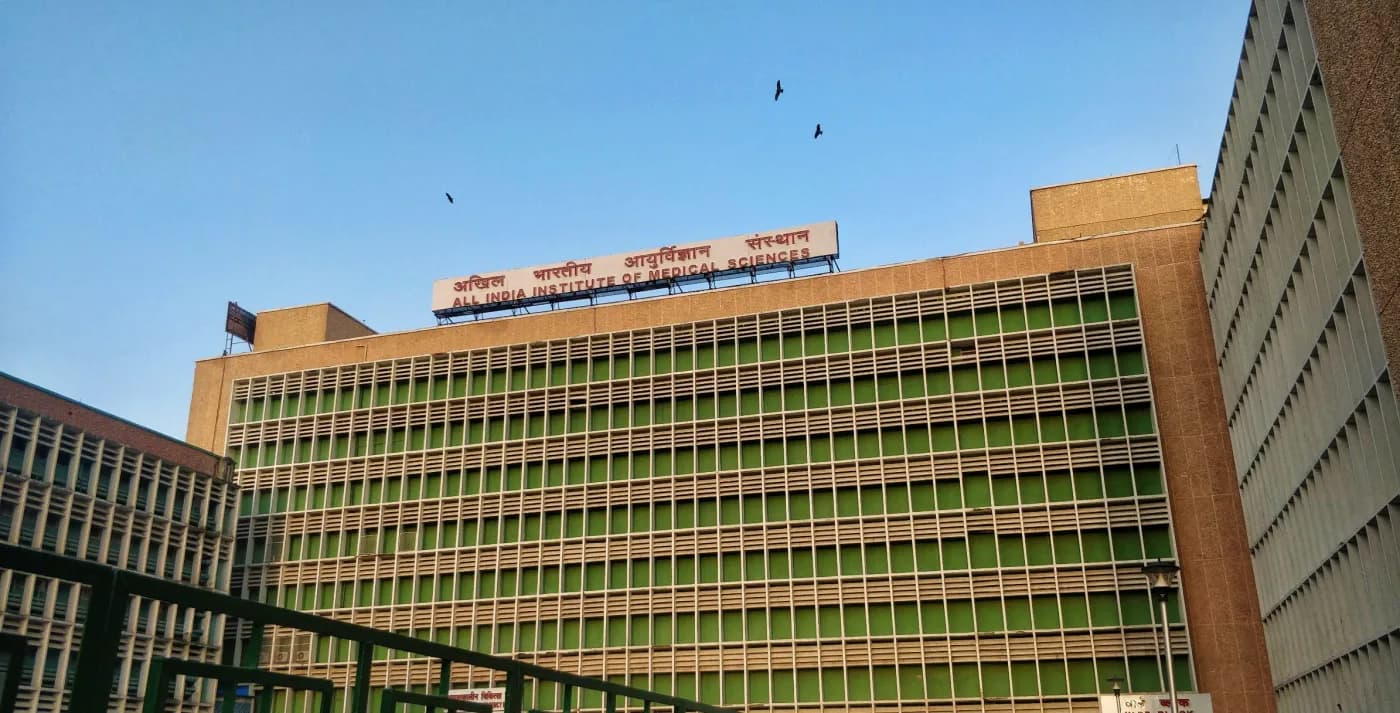
Health
387 → 780
Medical colleges
Live
Education
723 → 1,170
Universities
Live
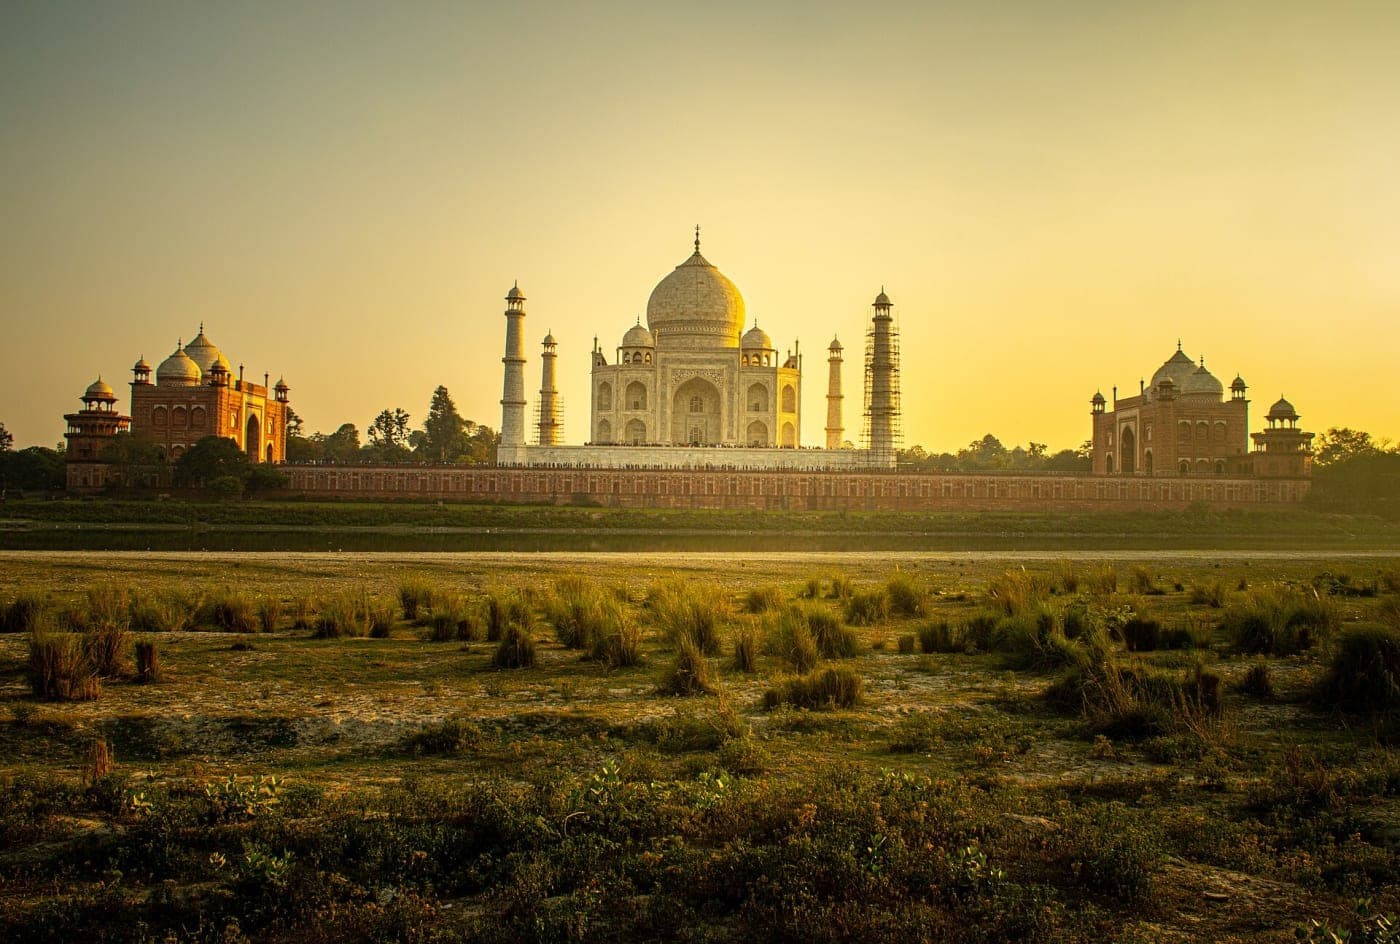
Tourism & Heritage
44 sites
UNESCO World Heritage
Live
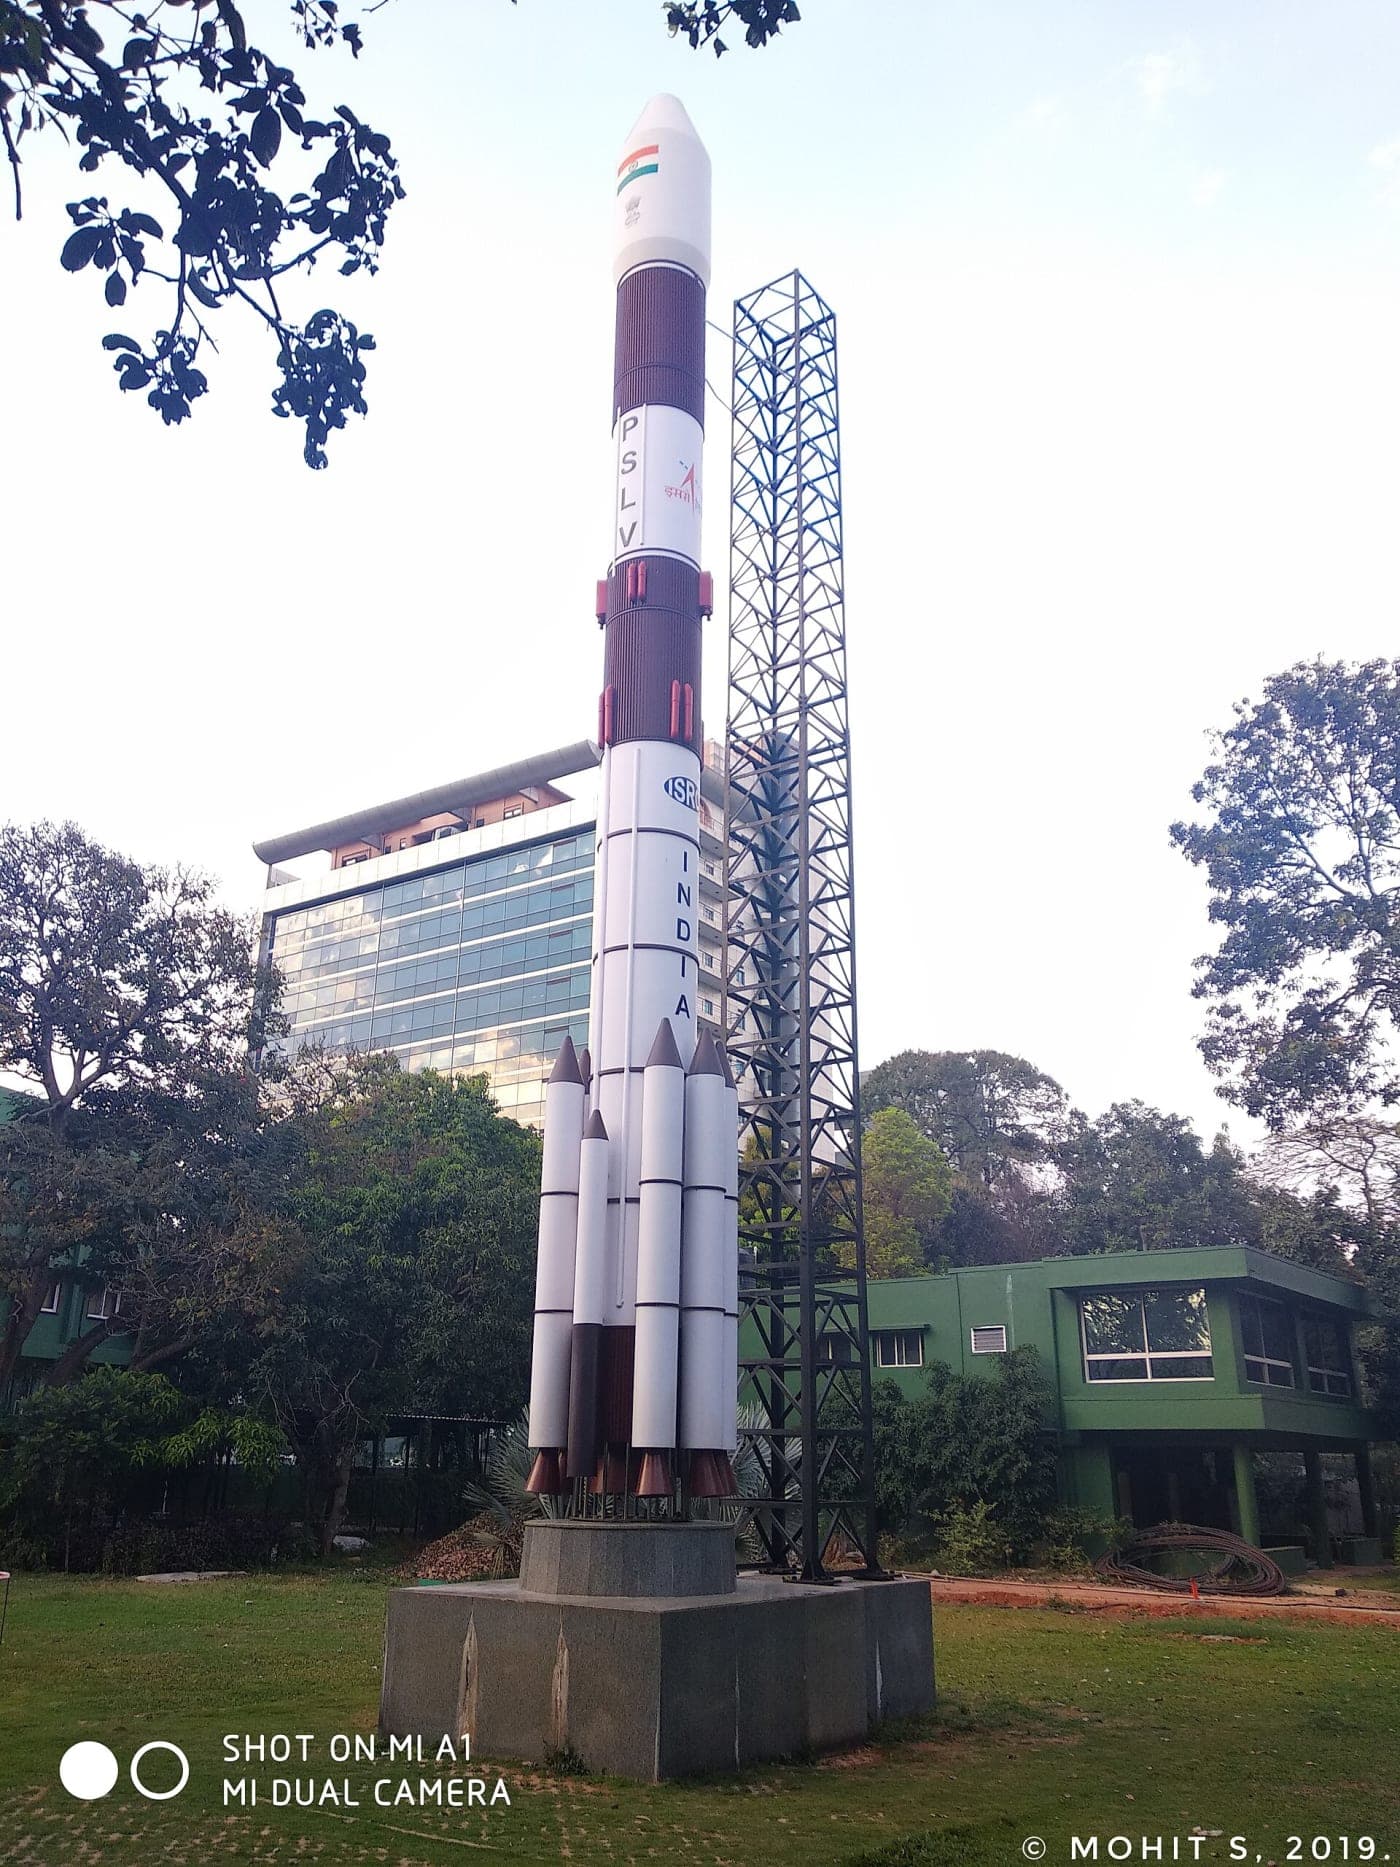
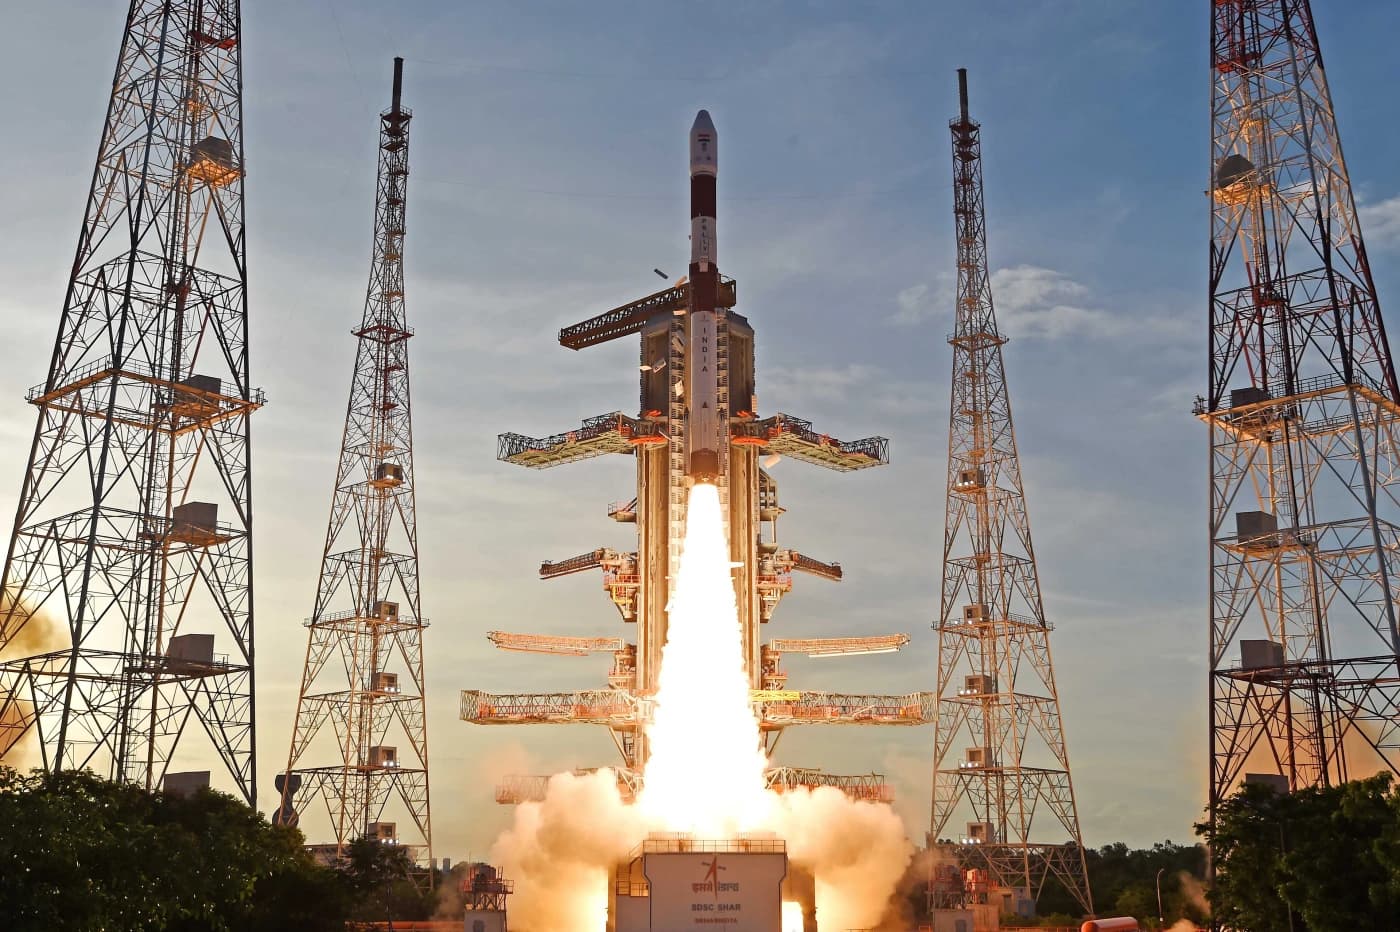
Space · ISRO
Moon
Missions & launches
Live
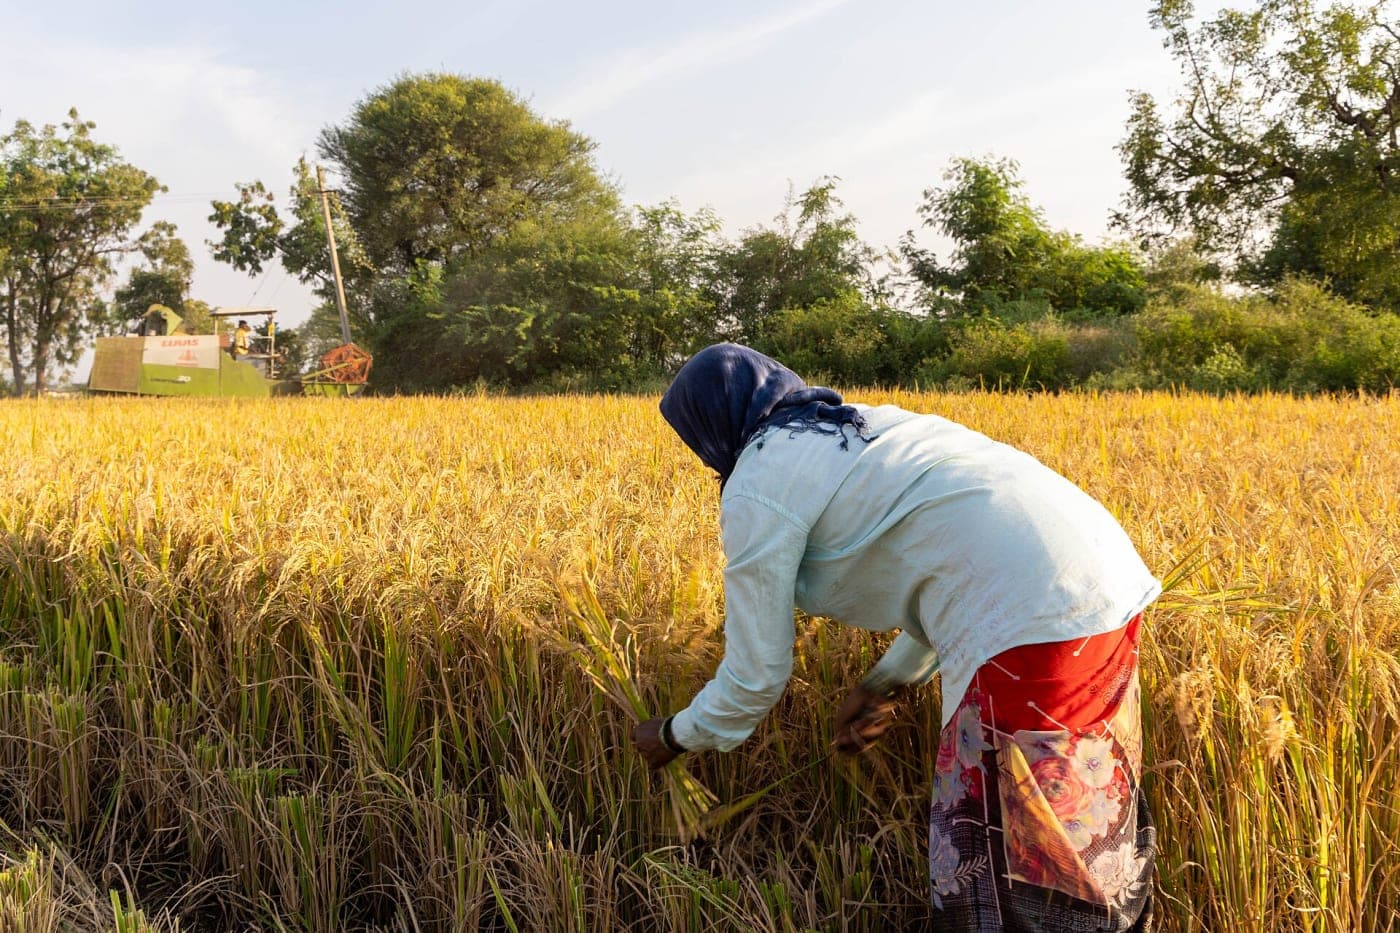
Agriculture & Farmers
265 → 358 MT
Foodgrain production
Live
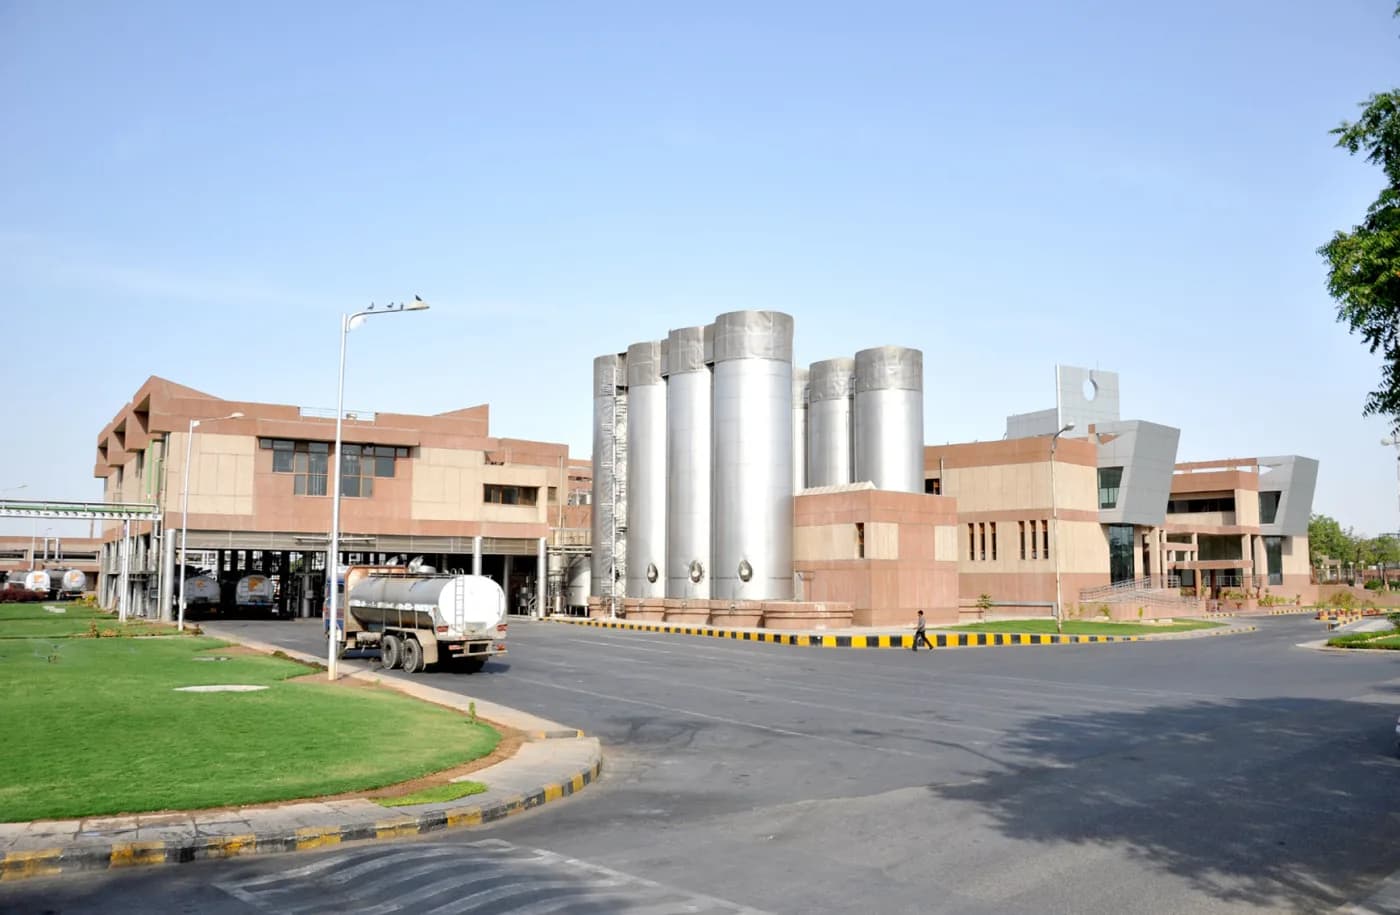
Dairy & Milk
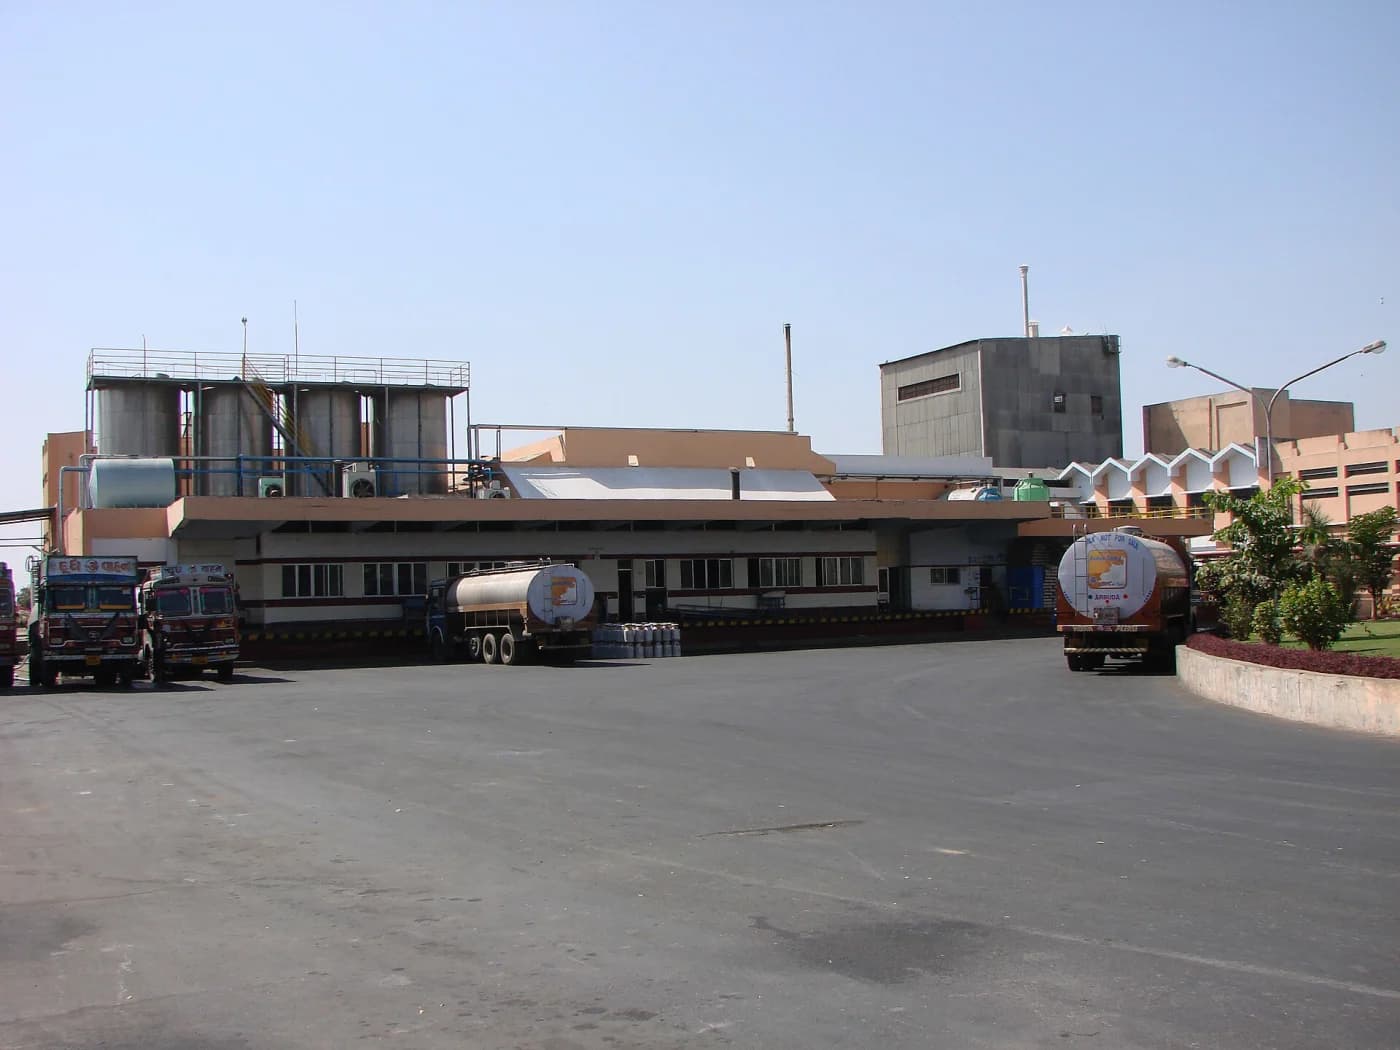
146 → 248 MT
Milk production
Live
Sports · Khelo India
57 → 107
Asian Games medals
Live
Beti Bachao Beti Padhao
918 → 933
Sex ratio at birth
Live
Insurance & Pension
0 → 80 cr
Jan Suraksha enrollments
Live
COVID Vaccination · Co-WIN
0 → 220 cr
Vaccine doses given
Live
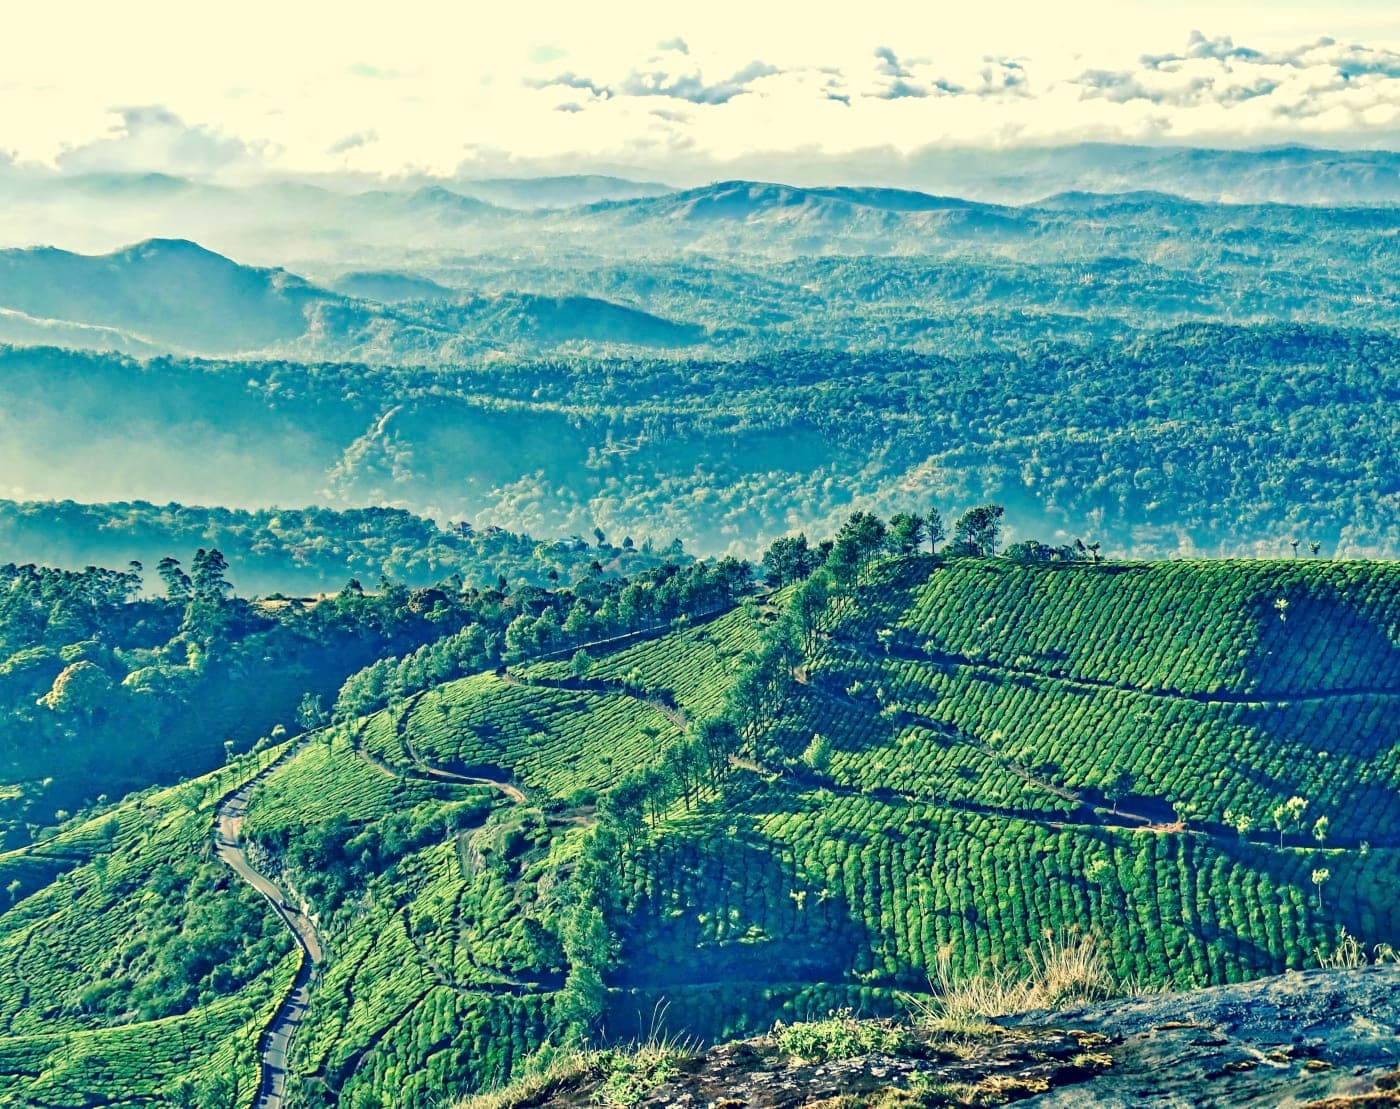
Tea & Plantations
1,200 → 1,340
Tea production (M kg)
Live
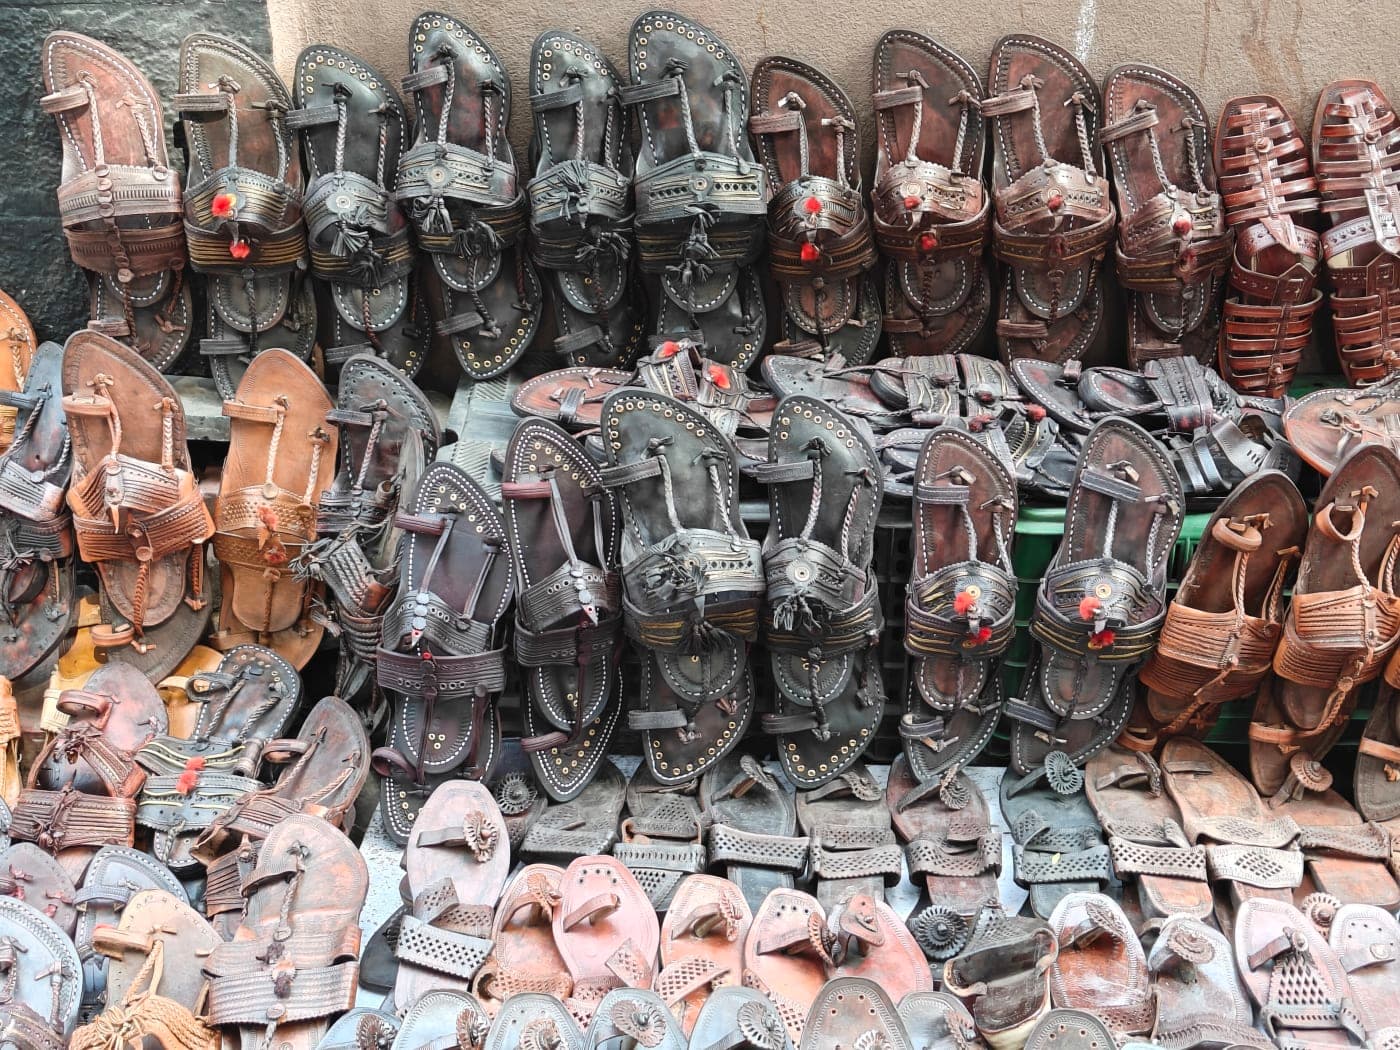
Handicrafts
~$3.5 → 4.5 bn
Handicraft exports
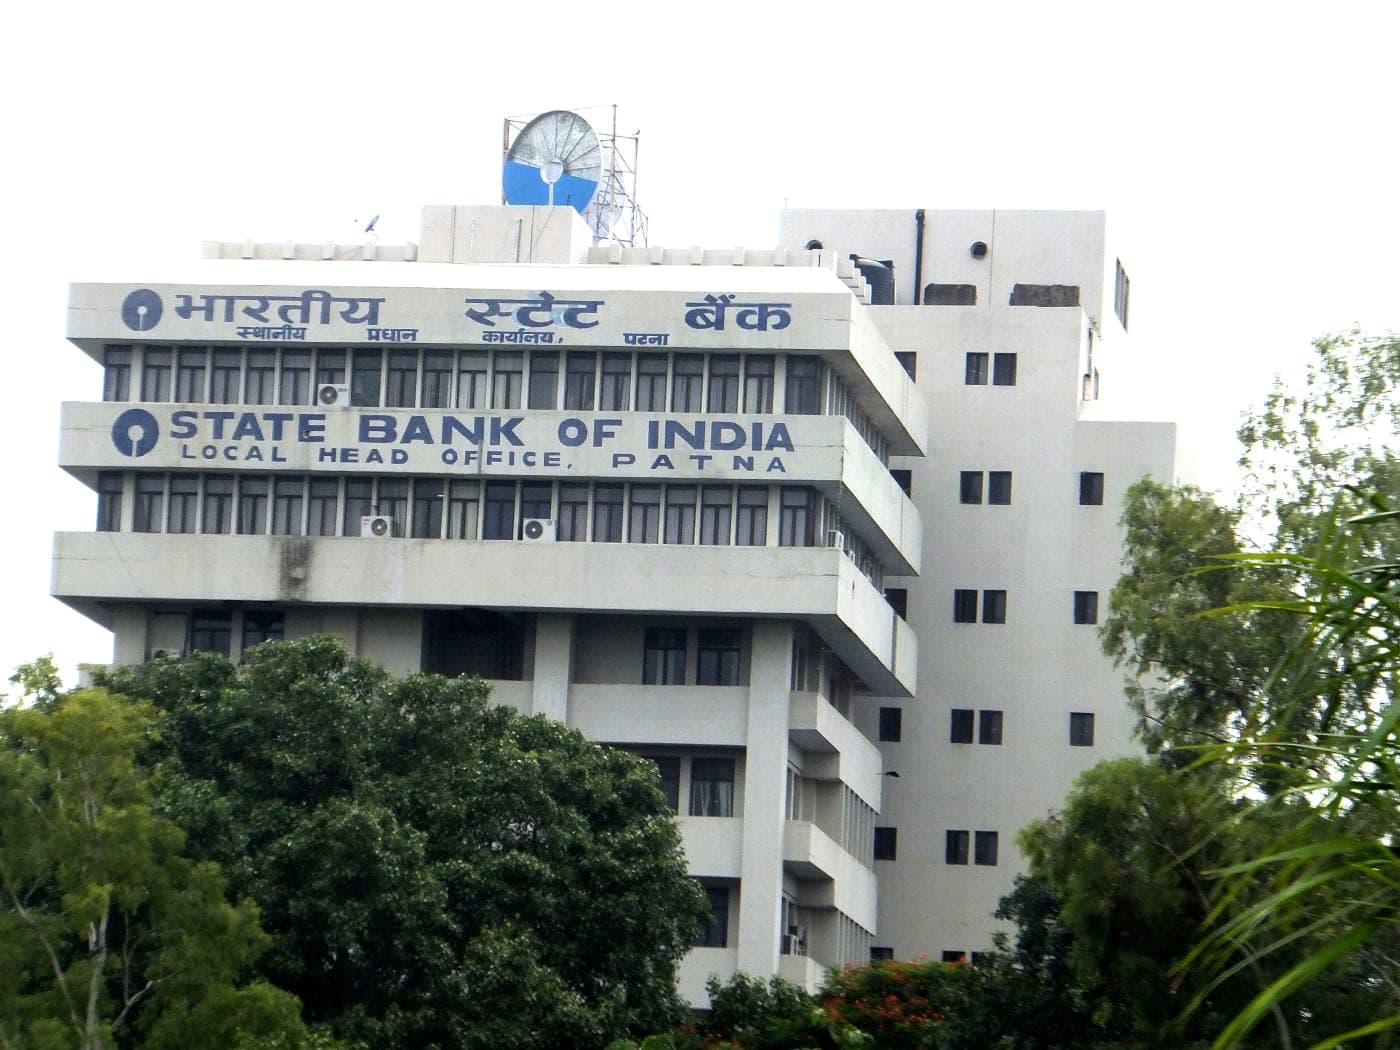
Live
AYUSH & Traditional Medicine
~$3 → 24 bn
AYUSH sector size
Live
NRIs & the Diaspora
$70 → 135 bn
Annual remittances
Live
Poverty Reduction
29 → 11%
Multidimensional poverty (%)
Live
Women's Empowerment & SHGs
2.5 → 10 cr
Women in SHGs
Live
Labour & Social Security
0 → 30.7 cr
e-Shram registrations
Live
Nutrition · POSHAN
38% → 35.5%
Child stunting (under-5)
Live
Tribal & Social Justice
Janjatiya
Tribal welfare
Live
Ayushman Bharat
0 → 42 cr
Ayushman cards issued
Live
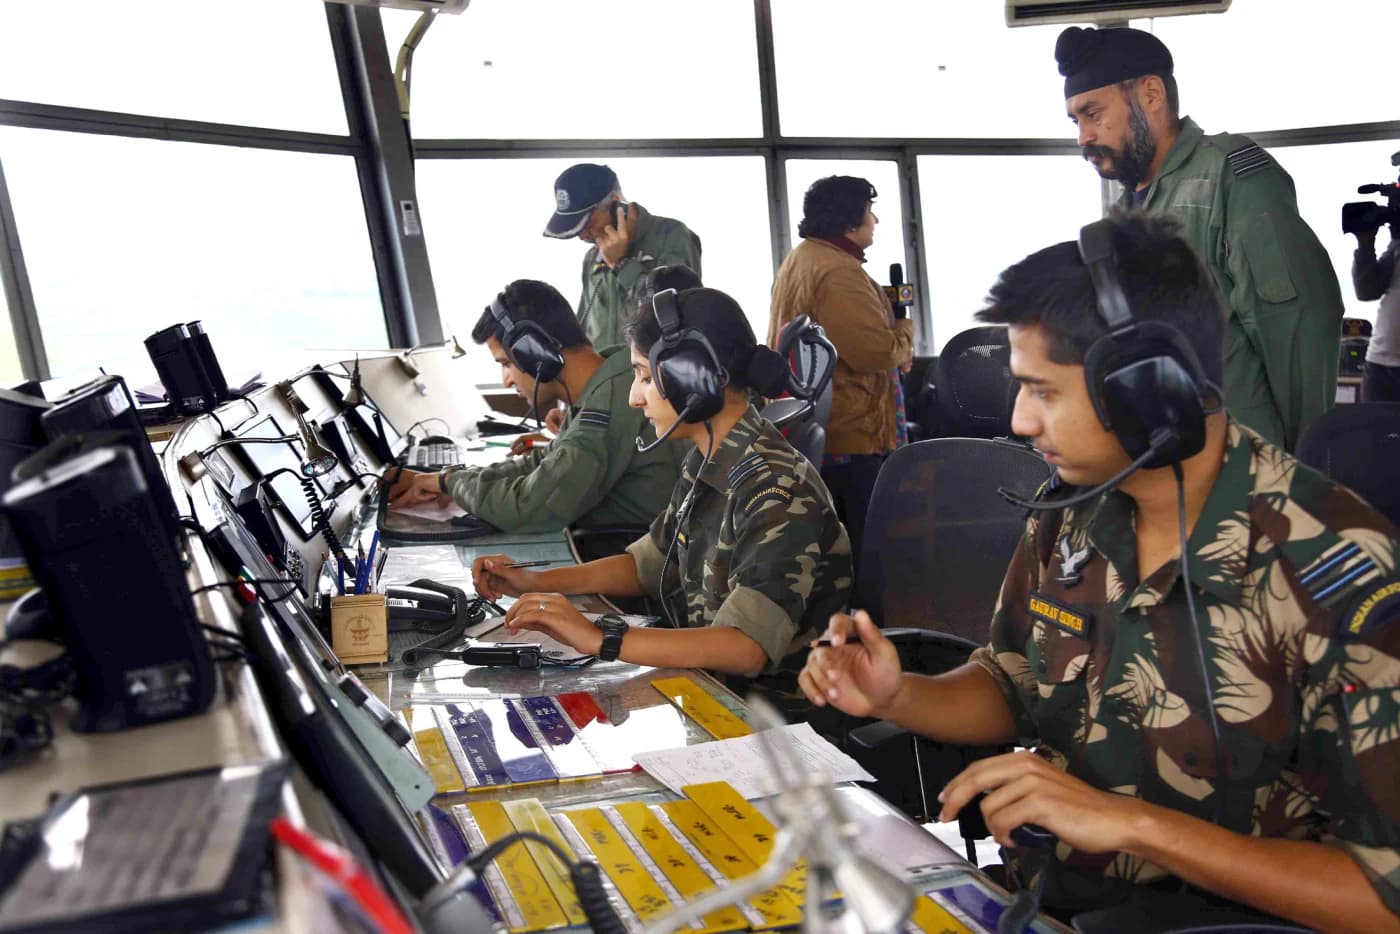
Defence & Indigenisation
₹0.5 → 1.78 L cr
Defence production
Live
Digital Health · ABDM
0 → 80 cr
ABHA health IDs
Live
Direct Benefit Transfer
₹1 → 44 L cr
Cumulative DBT transferred
Live
Creative Economy · AVGC
2 → 52 cr
Online gamers

Latest

Blog
Why 2014 was a turning point
India was independent for 67 years before most of what this site maps. So why did so much of it arrive after 2014? The honest answer runs through 1947, 1991 — and a government that made delivery its organising idea.
Every sector of India, in one place
Why we built India Unfolding — and how to read it.
How India took to the skies
The airport map doubled and a nation started flying — the UDAN story.
About this project

India Unfolding maps, counts, and animates the growth of India's public infrastructure from 2014 to today. The idea is simple: take scattered figures from government ministries and turn them into something you can actually see — highways lengthening, rail lines electrifying, airports and metros multiplying, year by year.

Each sector is a small interactive module — an animated map, a growing counter, or a timeline — that you can play, pause, and click for detail. The site is bilingual (English and हिन्दी) and built to keep growing as new data and sectors are added.

The numbers come from public sources — MoRTH, NHAI, the Ministry of Railways, NPCI, ISRO, and others — noted on each page. This is a data project, not a political one: the figures are laid out plainly for you to explore and draw your own conclusions.


It's built and maintained independently, as a solo project — not affiliated with any government body or organization.